

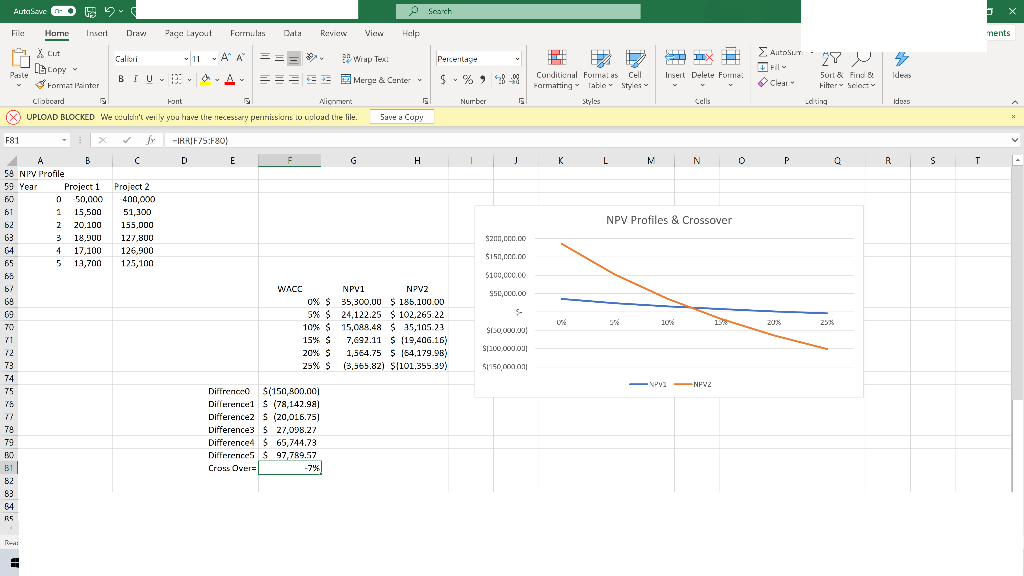
Question: On this excel assignment, my NPV graph shows a different cross-over rate than when I input the formula on excel. Am I doing something wrong?
On this excel assignment, my NPV graph shows a different cross-over rate than when I input the formula on excel. Am I doing something wrong? I don't quite understand what the issue could be
. 
Ruta Same - Seach X Filc Horne Inscurt Drav Page Layout Formulas Data Reviews View Help : nents Autos Caligi === en Wrap Text Percentage X C.it LL Copy Format Painter 11AA A 27 V 4 UF Pasle Insert Delete Forma Ides BIU. == Merge & Center Curditional Formalus Cell Formatting Table Styles Clean Sunt & Fins & Filter Solo Clipboard Fant Nignment Nurrber Cells .dting Idees UPLOAD BLOCKED We wouluil'l verily you have lile necessary permission lo usload Lire lile. Save a Copy F81 -IRRIF75:+80) C D E G H 1 J K L N N R S T Project 2 -400,000 51.300 NPV Profiles & Crossover A B 59 NP Profile 59 Year Project 1 0 50,000 61 1 15,500 62 2 20.100 63 3 18,900 64 4 17.100 65 5 13,700 65 6: 69 $200,000.00 155.000 127.800 126.900 12.5,100 $150,000.00 5100,CCC.CO $50,000.00 s 30 20% WACC NPVI NPV2 0% $ 35,300.00 $ 185.100.00 5% $ 24.122.25 $ 102,265 22 10% $ 15,099.48 $ 25,105.23 15% $ 7,692.11 $ (19,406.16) 20% s 1,564.75 $ 154,179.98) 25% $ (3,565.82) $1101.355 39) 25% S130,000.00 S1200,000.00 $1150 0090 70 71 72 73 74 75 75 13 78 79 2 NFV2 Diffrence $1150,800.00 Difference1 $ (78,142.98) Difference2 $ (20,016.75) Differences $ 27,098.27 Difference4 $ 65,744.73 Differences $ 97,789.57 Cross Over = -7% 81 82 83 64 RE
Step by Step Solution
There are 3 Steps involved in it

Get step-by-step solutions from verified subject matter experts