

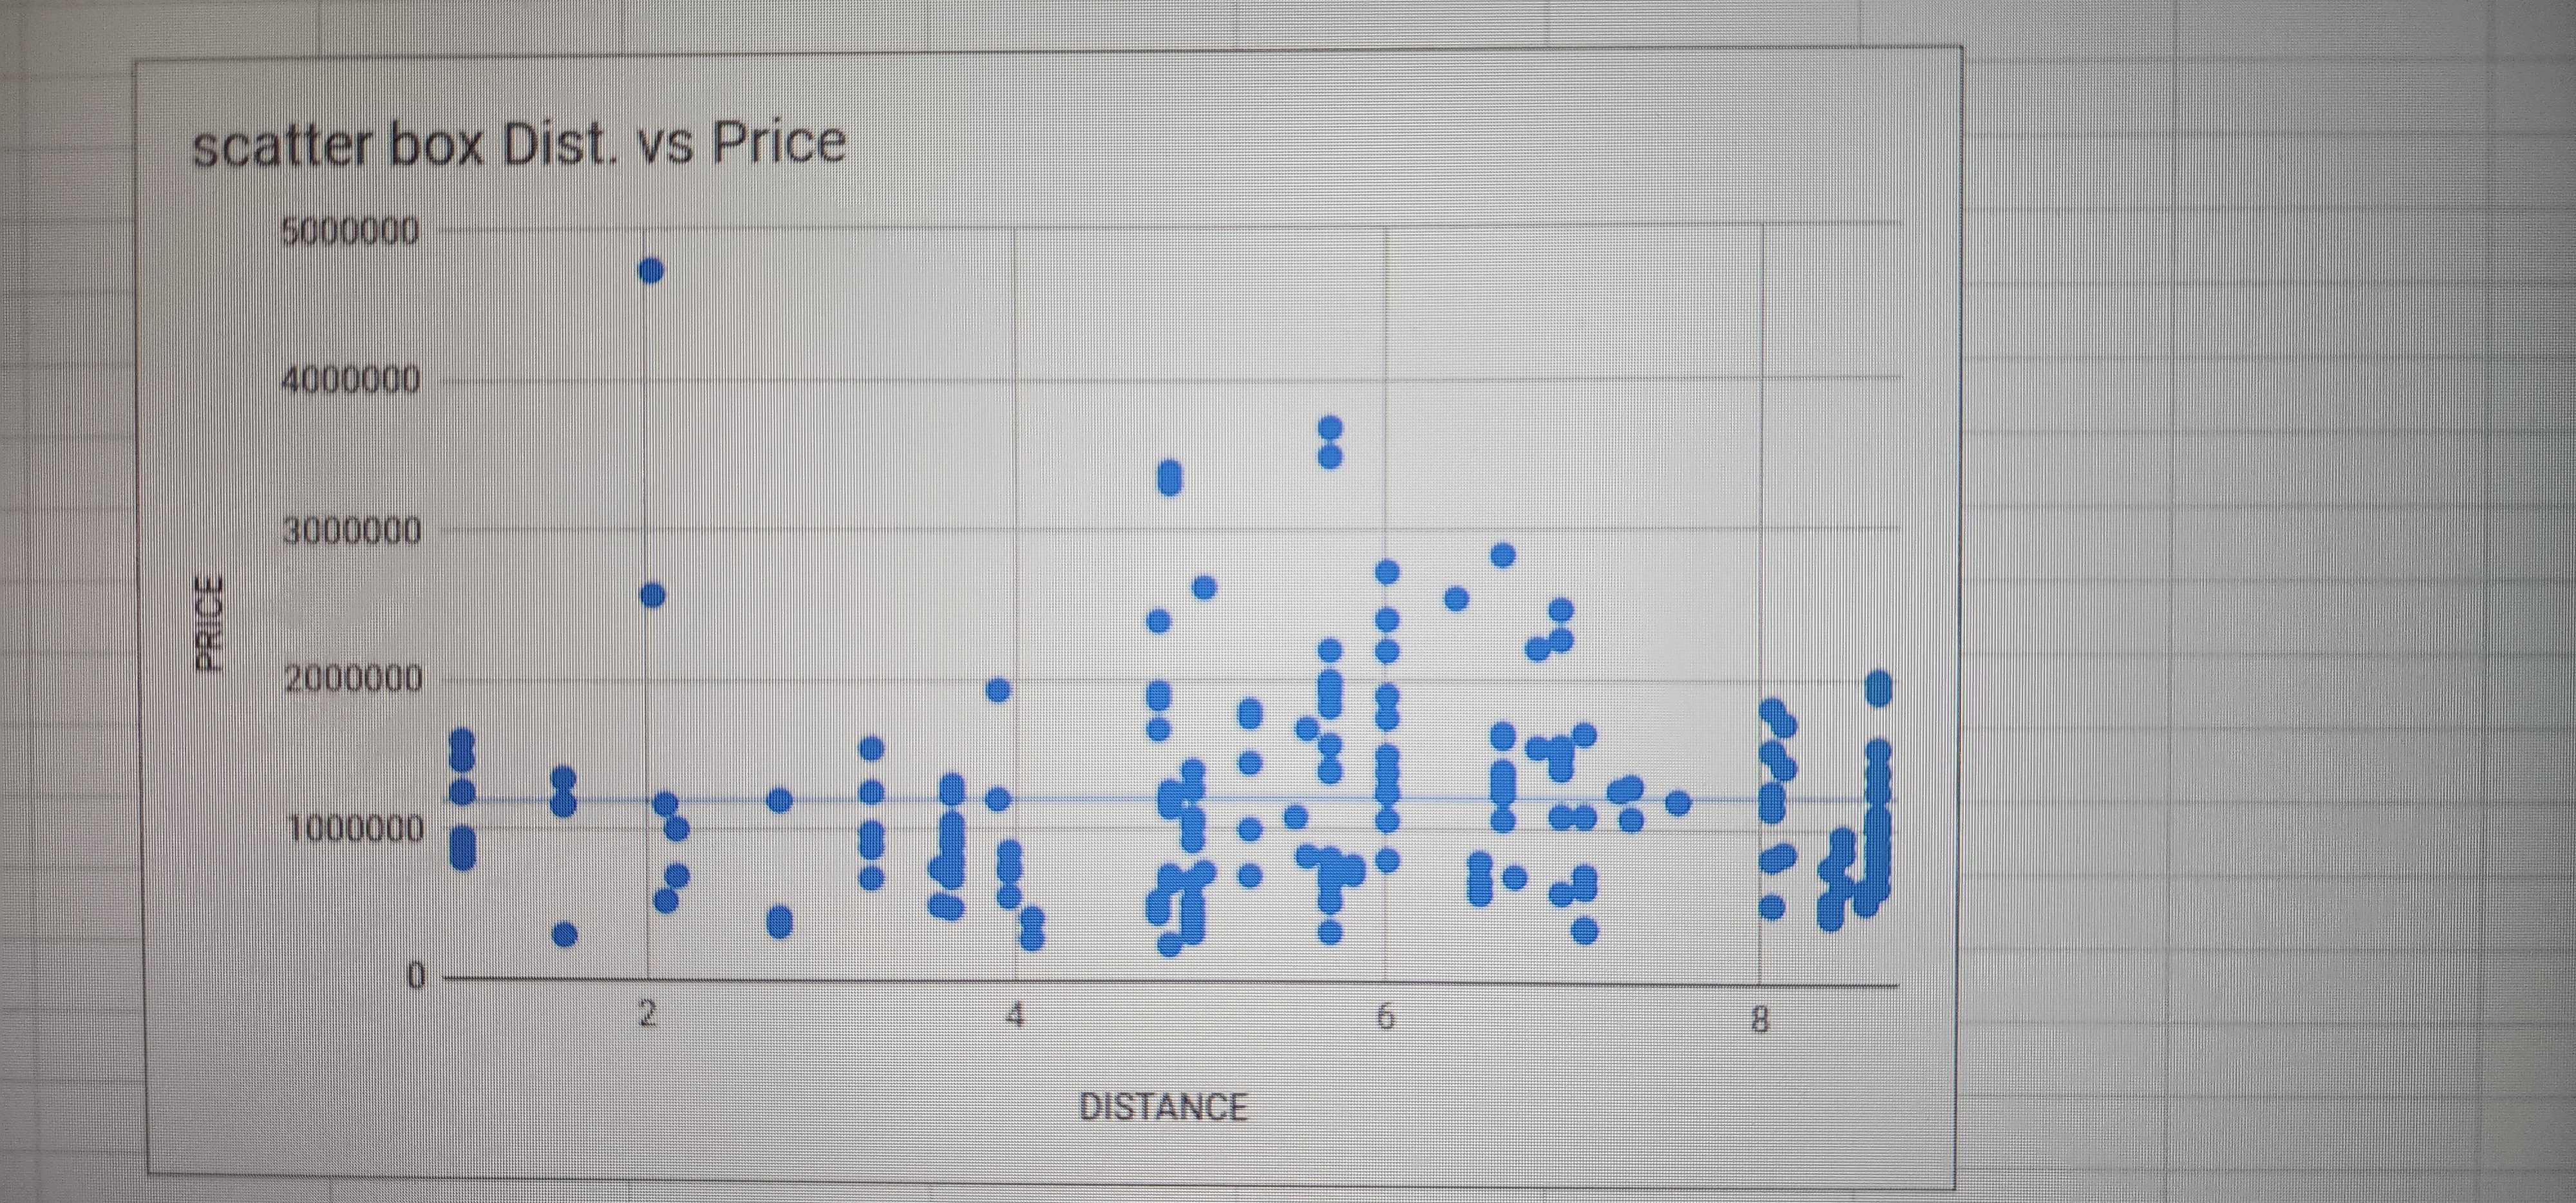
Question: On this slide, include the scatter plot (which should include the trend line/regression line), the equation of your regression line, and your r value. Identify
On this slide, include the scatter plot (which should include the trend line/regression line), the equation of your regression line, and yourr value. Identify your dependent and independent variable. Comment on the strength of the relationship between home property prices and distance from the Central Business District. Then, analyze your findings based on what you have learned about regression in this class.
\f
Step by Step Solution
There are 3 Steps involved in it
1 Expert Approved Answer
Step: 1 Unlock

Question Has Been Solved by an Expert!
Get step-by-step solutions from verified subject matter experts
Step: 2 Unlock
Step: 3 Unlock