

Question: On this worksheet, make an XY scatter plot linked to the following data: 17) X Y 92 22 87 102 23 80 25 91 27
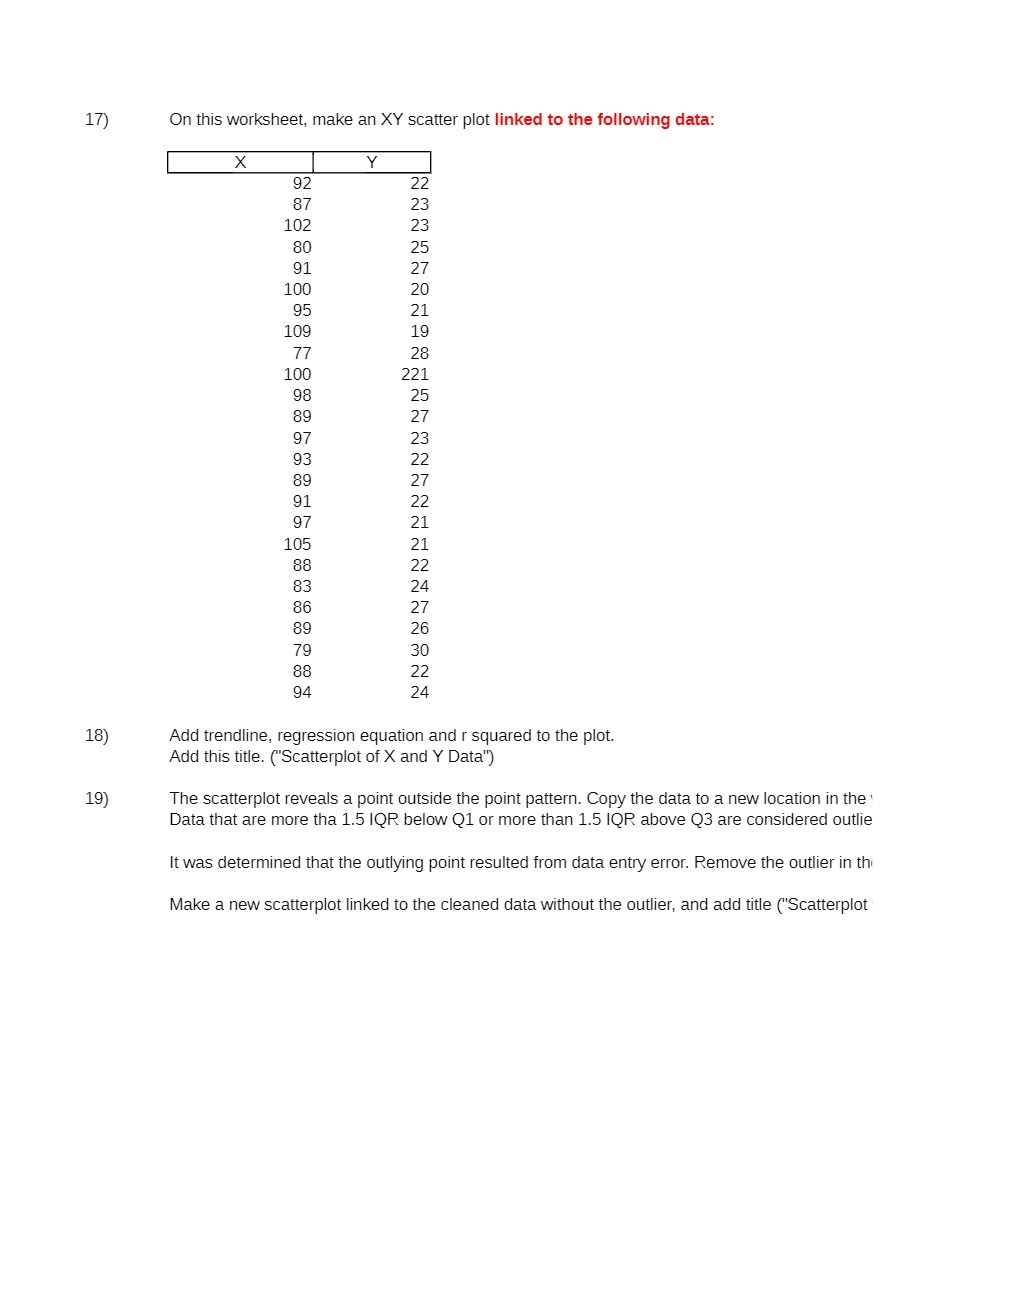
On this worksheet, make an XY scatter plot linked to the following data: 17) X Y 92 22 87 102 23 80 25 91 27 100 20 95 21 109 19 28 21 25 97 23 93 89 91 22 21 105 21 88 22 24 86 27 89 26 79 30 88 22 94 24 18) Add trendline, regression equation and r squared to the plot. Add this title. ("Scatterplot of X and Y Data") The scatterplot reveals a point outside the point pattern. Copy the data to a new location in the 19) Data that are more tha 1.5 IQR below Q1 or more than 1.5 IQR above Q3 are considered outlie It was determined that the outlying point resulted from data entry error. Remove the outlier in the Make a new scatterplot linked to the cleaned data without the outlier, and add title ("Scatterplot
Step by Step Solution
There are 3 Steps involved in it

Get step-by-step solutions from verified subject matter experts