

Question: on UPS company How does each ratio compare with key competitors? How has each ratio changed over time? Q-income st Done 4 matches 2017 2020
 on UPS company
How does each ratio compare with key competitors?
How has each ratio changed over time?
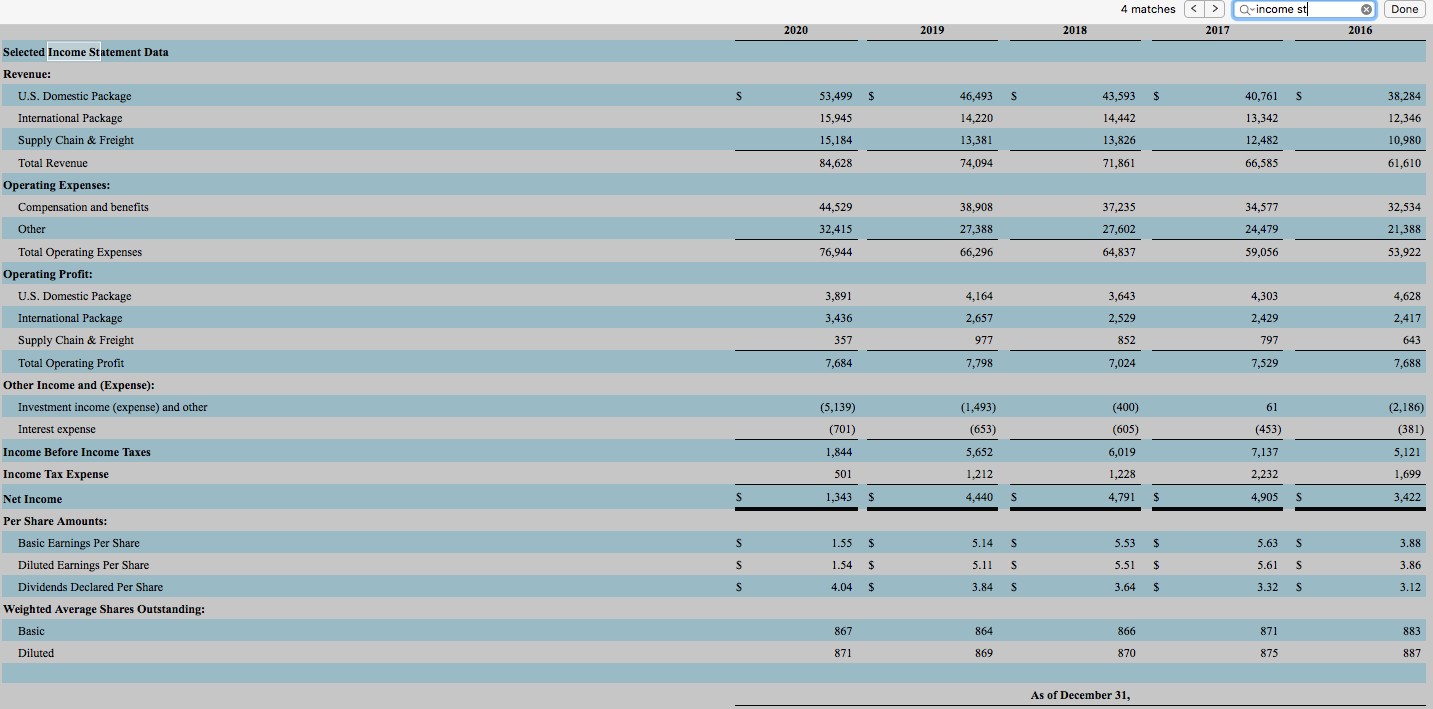
Q-income st Done 4 matches 2017 2020 2019 2018 2016 Selected Income Statement Data Revenue: U.S. Domestic Package International Package Supply Chain & Freight S S S 43,593 S S 53,499 15,945 46,493 14,220 40,761 13,342 38,284 12,346 14,442 15,184 13,381 13,826 12,482 10,980 Total Revenue 84,628 74,094 71,861 66,585 61,610 Operating Expenses: Compensation and benefits Other 44,529 38,908 37.235 34,577 32,534 32,415 27,388 27,602 24,479 21,388 76,944 66,296 64,837 59,056 53,922 4,303 4,628 3,891 3,436 357 4,164 2,657 3,643 2,529 2,429 2,417 977 852 797 643 Total Operating Expenses Operating Profit: U.S. Domestic Package International Package Supply Chain & Freight Total Operating Profit Other Income and (Expense): Investment income (expense) and other Interest expense Income Before Income Taxes Income Tax Expense 7,684 7,798 7,024 7,529 7,688 61 (2,186) (5,139) (701) (1,493) (653) (400) (605) (453) (381) 5,121 1,844 5,652 6,019 7,137 501 1,212 1,228 2,232 1,699 Net Income S 1,343 $ 4,440 S 4,791 $ 4,905 S 3,422 Per Share Amounts: S 1.55 $ 5.14 S 5.53 $ 5.63 S 3.88 S 1.54 $ 5.11 S 5.51 $ 5.61 S 3.86 Basic Earnings Per Share Diluted Earnings Per Share Dividends Declared Per Share Weighted Average Shares Outstanding: Basic S 4.04 $ 3.84 S 3.64 S 3.32 S 3.12 867 864 866 871 883 Diluted 871 869 870 875 887 As of December 31, Q-income st Done 4 matches 2017 2020 2019 2018 2016 Selected Income Statement Data Revenue: U.S. Domestic Package International Package Supply Chain & Freight S S S 43,593 S S 53,499 15,945 46,493 14,220 40,761 13,342 38,284 12,346 14,442 15,184 13,381 13,826 12,482 10,980 Total Revenue 84,628 74,094 71,861 66,585 61,610 Operating Expenses: Compensation and benefits Other 44,529 38,908 37.235 34,577 32,534 32,415 27,388 27,602 24,479 21,388 76,944 66,296 64,837 59,056 53,922 4,303 4,628 3,891 3,436 357 4,164 2,657 3,643 2,529 2,429 2,417 977 852 797 643 Total Operating Expenses Operating Profit: U.S. Domestic Package International Package Supply Chain & Freight Total Operating Profit Other Income and (Expense): Investment income (expense) and other Interest expense Income Before Income Taxes Income Tax Expense 7,684 7,798 7,024 7,529 7,688 61 (2,186) (5,139) (701) (1,493) (653) (400) (605) (453) (381) 5,121 1,844 5,652 6,019 7,137 501 1,212 1,228 2,232 1,699 Net Income S 1,343 $ 4,440 S 4,791 $ 4,905 S 3,422 Per Share Amounts: S 1.55 $ 5.14 S 5.53 $ 5.63 S 3.88 S 1.54 $ 5.11 S 5.51 $ 5.61 S 3.86 Basic Earnings Per Share Diluted Earnings Per Share Dividends Declared Per Share Weighted Average Shares Outstanding: Basic S 4.04 $ 3.84 S 3.64 S 3.32 S 3.12 867 864 866 871 883 Diluted 871 869 870 875 887 As of December 31Step by Step Solution
There are 3 Steps involved in it
1 Expert Approved Answer
Step: 1 Unlock

Question Has Been Solved by an Expert!
Get step-by-step solutions from verified subject matter experts
Step: 2 Unlock
Step: 3 Unlock