

Question: Once you have completed your financial analysis, interpret the ratios and vertical and horizontal analyses to evaluate the business performance of Lueders Medical Clinic. In
Once you have completed your financial analysis, interpret the ratios and vertical and horizontal analyses to evaluate the business performance of Lueders Medical Clinic.
In your brief, make sure to refer to your financial analysis workbook. It is important that you explain what each ratio tells you about the clinic?s performance. Then, recommend whether it is a good investment for the hospital to purchase the clinic. Use your financial analysis workbook to explain your decision.
Specifically, address the following in your brief:
- Examine the clinic?s financial performance.
- How does the clinic?s financial performance compare against industry averages and past performance?
- What are the strengths and weaknesses of the clinic?s financial performance?
- Recommend appropriate actions using your financial analysis as support.
- Is purchasing the clinic is a good or bad investment?
- What are some potential areas of improvement?
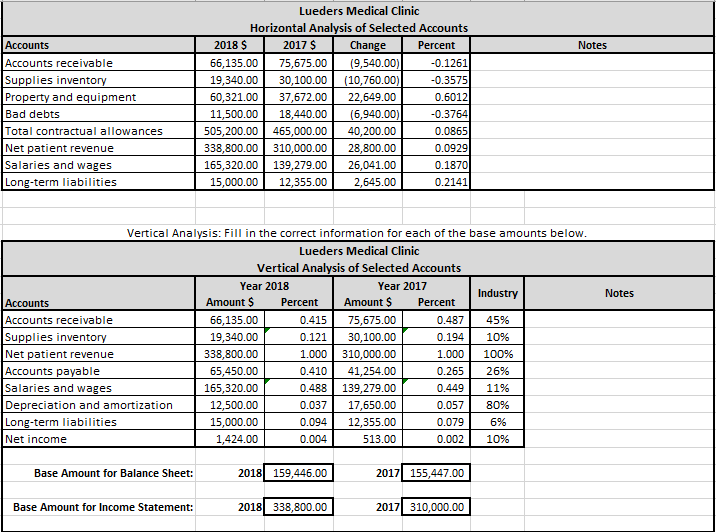
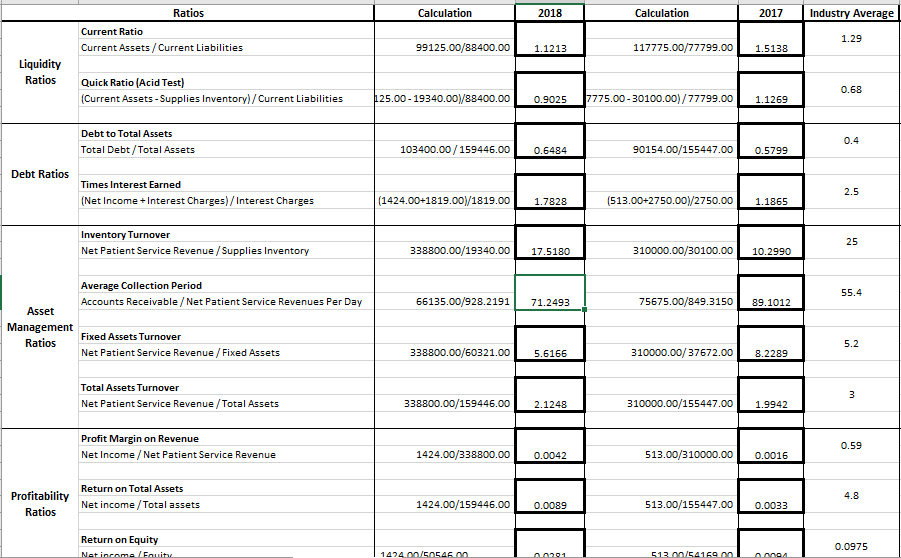
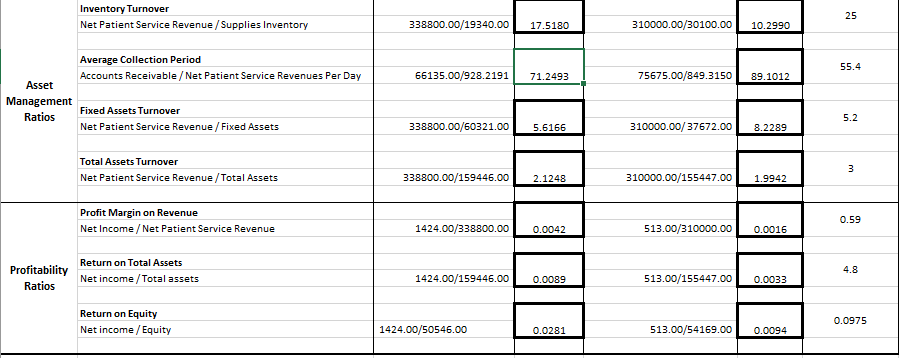
Accounts Accounts receivable Supplies inventory Property and equipment Bad debts Total contractual allowances Net patient revenue Salaries and wages Long-term liabilities Accounts Accounts receivable Supplies inventory Net patient revenue Accounts payable Salaries and wages Depreciation and amortization Long-term liabilities Net income Base Amount for Balance Sheet: Lueders Medical Clinic Horizontal Analysis of Selected Accounts 2018 $ 2017 $ Change Percent 66,135.00 75,675.00 (9,540.00) 19,340.00 30,100.00 (10,760.00) 60,321.00 37,672.00 22,649.00 11,500.00 18,440.00 (6,940.00) 505,200.00 465,000.00 40,200.00 338,800.00 310,000.00 28,800.00 165,320.00 139,279.00 26,041.00 15,000.00 12,355.00 2,645.00 Vertical Analysis: Fill in the correct information for each of the base amounts below. Lueders Medical Clinic Vertical Analysis of Selected Accounts Year 2018 Base Amount for Income Statement: Amount $ 66,135.00 19,340.00 338,800.00 65,450.00 165,320.00 12,500.00 15,000.00 1,424.00 Percent 2018 159,446.00 Year 2017 0.415 75,675.00 0.121 30,100.00 1.000 310,000.00 0.410 41,254.00 0.488 139,279.00 0.037 17,650.00 0.094 12,355.00 0.004 513.00 2018 338,800.00 Amount $ -0.1261 -0.3575 0.6012 -0.3764 0.0865 0.0929 0.1870 0.2141 Percent 0.487 0.194 1.000 0.265 0.449 0.057 0.079 0.002 2017 155,447.00 2017 310,000.00 Industry Notes 45% 10% 100% 26% 11% 80% 6% 10% Notes Liquidity Ratios Debt Ratios Asset Management Ratios Profitability Ratios Ratios Current Ratio Current Assets/Current Liabilities Quick Ratio (Acid Test) (Current Assets - Supplies Inventory)/Current Liabilities Debt to Total Assets Total Debt/Total Assets Times Interest Earned (Net Income + Interest Charges)/Interest Charges Inventory Turnover Net Patient Service Revenue/Supplies Inventory Average Collection Period Accounts Receivable / Net Patient Service Revenues Per Day Fixed Assets Turnover Net Patient Service Revenue / Fixed Assets Total Assets Turnover Net Patient Service Revenue / Total Assets Profit Margin on Revenue Net Income / Net Patient Service Revenue Return on Total Assets Net income / Total assets Return on Equity Net income /Equity Calculation 99125.00/88400.00 1.1213 125.00-19340.00)/88400.00 103400.00/159446.00 2018 0.6484 (1424.00+1819.00)/1819.00 1.7828 338800.00/19340.00 17.5180 0.9025 7775.00-30100.00)/77799.00 1.1269 66135.00/928.2191 71.2493 338800.00/60321.00 5.6166 338800.00/159446.00 2.1248 1424.00/50545.00 1424.00/338800.00 0.0042 1424.00/159446.00 0.0089 Calculation 2017 117775.00/77799.00 1.5138 90154.00/155447.00 0.5799 (513.00+2750.00)/2750.00 1.1865 310000.00/30100.00 10.2990 75675.00/849.3150 89.1012 310000.00/37672.00 8.2289 310000.00/155447.00 1.9942 513.00/310000.00 0.0016 513.00/155447.00 0.0033 513.00/54169.00 0.0094 Industry Average 1.29 0.68 0.4 2.5 235 55.4 5.2 3 0.59 4.8 0.0975 Asset Management Ratios Profitability Ratios Inventory Turnover Net Patient Service Revenue/Supplies Inventory Average Collection Period Accounts Receivable / Net Patient Service Revenues Per Day Fixed Assets Turnover Net Patient Service Revenue / Fixed Assets Total Assets Turnover Net Patient Service Revenue / Total Assets Profit Margin on Revenue Net Income / Net Patient Service Revenue Return on Total Assets Net income / Total assets Return on Equity Net income/Equity 338800.00/19340.00 17.5180 66135.00/928.2191 71.2493 338800.00/60321.00 5.6166 338800.00/159446.00 2.1248 1424.00/338800.00 0.0042 1424.00/159446.00 0.0089 1424.00/50546.00 0.0281 310000.00/30100.00 10.2990 75675.00/849.3150 89.1012 310000.00/37672.00 8.2289 310000.00/155447.00 1.9942 513.00/310000.00 0.0016 513.00/155447.00 0.0033 513.00/54169.00 0.0094 25 55.4 5.2 3 0.59 4.8 0.0975
Step by Step Solution
3.40 Rating (147 Votes )
There are 3 Steps involved in it
s Medical Clinic 20172018 Financial Statements Lueders Medical Clinic Income Statement Year Ended December 31 Operating Revenue 2017 2018 Gross patien... View full answer

Get step-by-step solutions from verified subject matter experts