Question: Once you have read the case study, please use the provided spreadsheet below. Complete the common size, trend, and ratio tabs. The following values have
Once you have read the case study, please use the provided spreadsheet below. Complete the common size, trend, and ratio tabs. The following values have been entered into the worksheet as check values
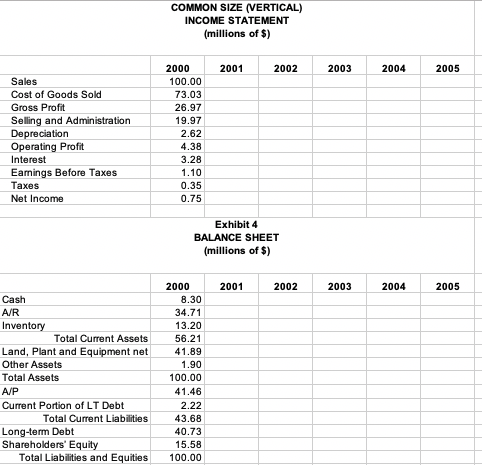
Year 2000 common size
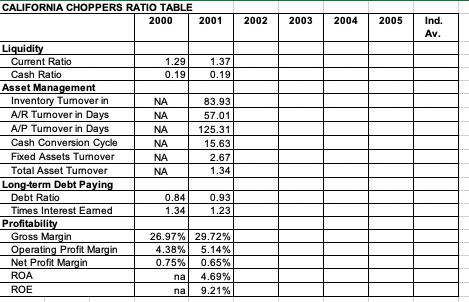
Years 2000 and 2001 for ratios
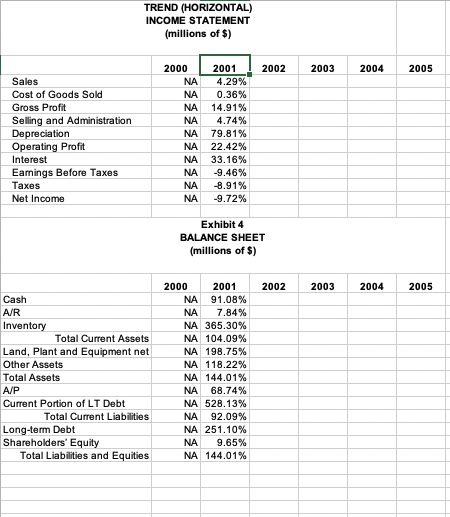
Years 2000 and 2001 trend
California Choppers Worksheet
After completing the quantitative portion of the spreadsheet, provide an analysis of California Choppers in 1,000 or less words. The narrative must fit in the red box on the "Narrative" tab in the worksheet. Do not change the format of this tab in any way. Assume that the reader has read the case. How is the company performing in terms of raw numbers year over year? How do their ratios stack up against industry averages? What does the trend and common size analysis reveal? What recommendations would you make to management based on your financial review?
You will not be able to speak to every issue in this review. You will not be able to address every issue in the space provided. It is up to you to determine what is relevant and important and discuss those issues in your narrative. Remember that it is important to know what is important.
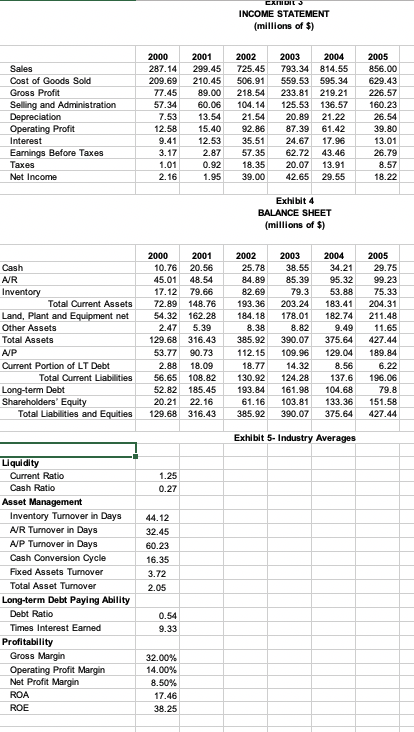
AIBIL INCOME STATEMENT (millions of $) 2000 2001 2002 2003 2004 2005 Sales 287.14 299.45 725.45 793.34 814.55 856.00 Cost of Goods Sold 209.69 210.45 506.91 559.53 595.34 629.43 Gross Profit 77.45 89.00 218.54 233.81 219.21 226.57 Selling and Administration 57.34 60.06 104.14 125.53 136.57 160.23 Depreciation 7.53 13.54 21.54 20.89 21.22 26.54 Operating Profit 12.59 15.40 92.86 87.39 61.42 39.80 Interest 9.41 12.53 35.51 24.67 17.96 13.01 Earnings Before Taxes 3.17 2.87 57.35 62.72 43.46 26.79 Taxes 1.01 0.92 18.35 20.07 13.91 8.57 Net Income 2.16 1.95 39.00 42.65 29.55 18.22 Exhibit 4 BALANCE SHEET (millions of $) 2000 2001 2002 2003 2004 2005 Cash 10.76 20.56 25.78 38.55 34.21 29.75 A/R 45.01 48.54 84.89 85.39 95.32 99.23 Inventory 17.12 79.66 82.69 79.3 53.88 75.33 Total Current Assets 72.89 148.76 193.36 203.24 183.41 204.31 Land, Plant and Equipment net 54.32 162.28 184.18 178.01 182.74 211.48 Other Assets 2.47 5.39 8.38 8.82 9.49 11.65 Total Assets 129.68 316.43 385.92 390.07 375.64 427.44 A/P 53.77 90.73 112.15 109.96 129.04 189.84 Current Portion of LT Debt 2.88 18.09 18.77 14.32 8.56 6.22 Total Current Liabilities 56.65 108.82 130.92 124.28 137.6 196.06 Long-term Debt 52.82 185.45 193.84 161.98 104.68 79.8 Shareholders' Equity 20.21 22.16 61.16 103.81 133.36 151.58 Total Liabilities and Equities 129.68 316.43 385.92 390.07 375.64 427.44 Exhibit 5- Industry Averages Liquidity Current Ratio 1.25 Cash Ratio 0.27 Asset Management Inventory Turnover in Days 44. 12 A/R Turnover in Days 32.45 A/P Tumover in Days 60.23 Cash Conversion Cycle 16.35 Fixed Assets Turnover 3.72 Total Asset Turnover 2.05 Long-term Debt Paying Ability Debt Ratio 0.54 Times Interest Earned 9.33 Profitability Gross Margin 32.00% Operating Profit Margin 14.00% Net Profit Margin 8.50%% ROA 17.46 ROE 38.25COMMON SIZE (VERTICAL) INCOME STATEMENT (millions of $) 2000 2001 2002 2003 2004 2005 Sales 100.00 Cost of Goods Sold 73.03 Gross Profit 26.97 Selling and Administration 19.97 Depreciation 2.62 Operating Profit 4.38 Interest 3.28 Eamings Before Taxes 1.10 Taxes 0.35 Net Income 0.75 Exhibit 4 BALANCE SHEET (millions of $) 2000 2001 2002 2003 2004 2005 Cash 8.30 A/R 34.71 Inventory 13.20 Total Current Assets 56.21 Land, Plant and Equipment net 41.89 Other Assets 1.90 Total Assets 100.00 A/P 41.46 Current Portion of LT Debt 2.22 Total Current Liabilities 43.68 Long-term Debt 40.73 Shareholders' Equity 15.58 Total Liabilities and Equities 100.00TREND (HORIZONTAL) INCOME STATEMENT (millions of $) 2000 2001 2002 2003 2004 2005 Sales NA 4.29% Cost of Goods Sold NA 0.36% Gross Profit NA 14.91% Selling and Administration NA 4.74% Depreciation NA 79.81% Operating Profit NA 22.42% Interest NA 33.16% Eamings Before Taxes NA -9.46% Taxes NA -8.91% Net Income NA -9.72% Exhibit 4 BALANCE SHEET [millions of $) 2000 2001 2002 2003 2004 2005 Cash NA 91.08% A/R NA 7.84% Inventory NA 365.30% Total Current Assets NA 104.09% Land, Plant and Equipment net NA 198.75% Other Assets NA 118.22% Total Assets NA 144.01% A/P NA 68.74% Current Portion of LT Debt NA 528.13% Total Current Liabilities NA 92.09% Long-term Debt NA 251.10% Shareholders' Equity NA 9.65% Total Liabilities and Equities NA 144.01%CALIFORNIA CHOPPERS RATIO TABLE 2000 2001 2002 2003 2004 2005 Ind. Av. Liquidity Current Ratio 1.29 1.37 Cash Ratio 0.19 0.19 Asset Management Inventory Tumover in NA 83.93 A/R Tumover in Days NA 57.01 A/P Tumover in Days NA 125.31 Cash Conversion Cycle NA 15.63 Fixed Assets Tumover NA 2.67 Total Asset Tumover NA 1.34 Long-term Debt Paying Debt Ratio 0.84 0.93 Times Interest Eamed 1.34 1.23 Profitability Gross Margin 26.97% 29.72% Operating Profit Margin 4.38% 5.14% Net Profit Margin 0.75% 0.65% ROA ne 4.69% ROE na 9.21%NARRATIVE Your narrative must fit in this box. If you edit in this box. Use Alt7 for bullet point and ALT Enter of return. This box can hold approximately 1,000 words as currently formatted. You can compose your narrative in Word and copy into this box as plain text only. Please do not change the format of this spreadsheet in any way
Step by Step Solution
There are 3 Steps involved in it
1 Expert Approved Answer
Step: 1 Unlock
Question Has Been Solved by an Expert!
Get step-by-step solutions from verified subject matter experts
Step: 2 Unlock
Step: 3 Unlock
Students Have Also Explored These Related Finance Questions!