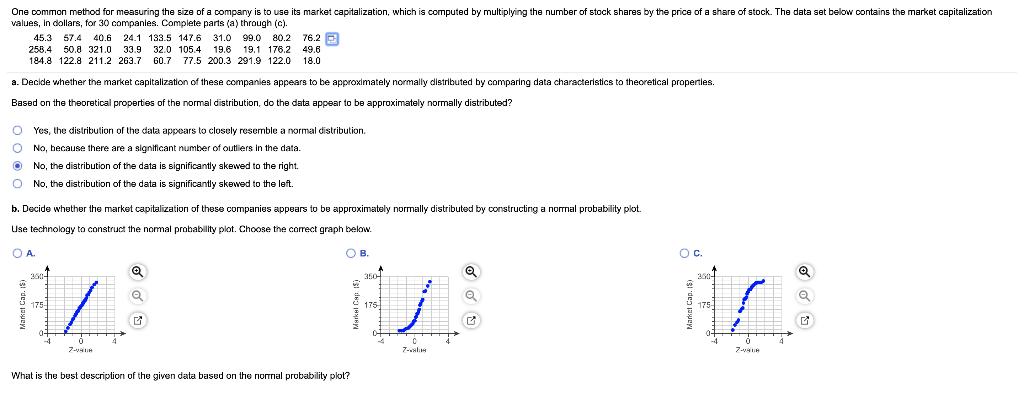
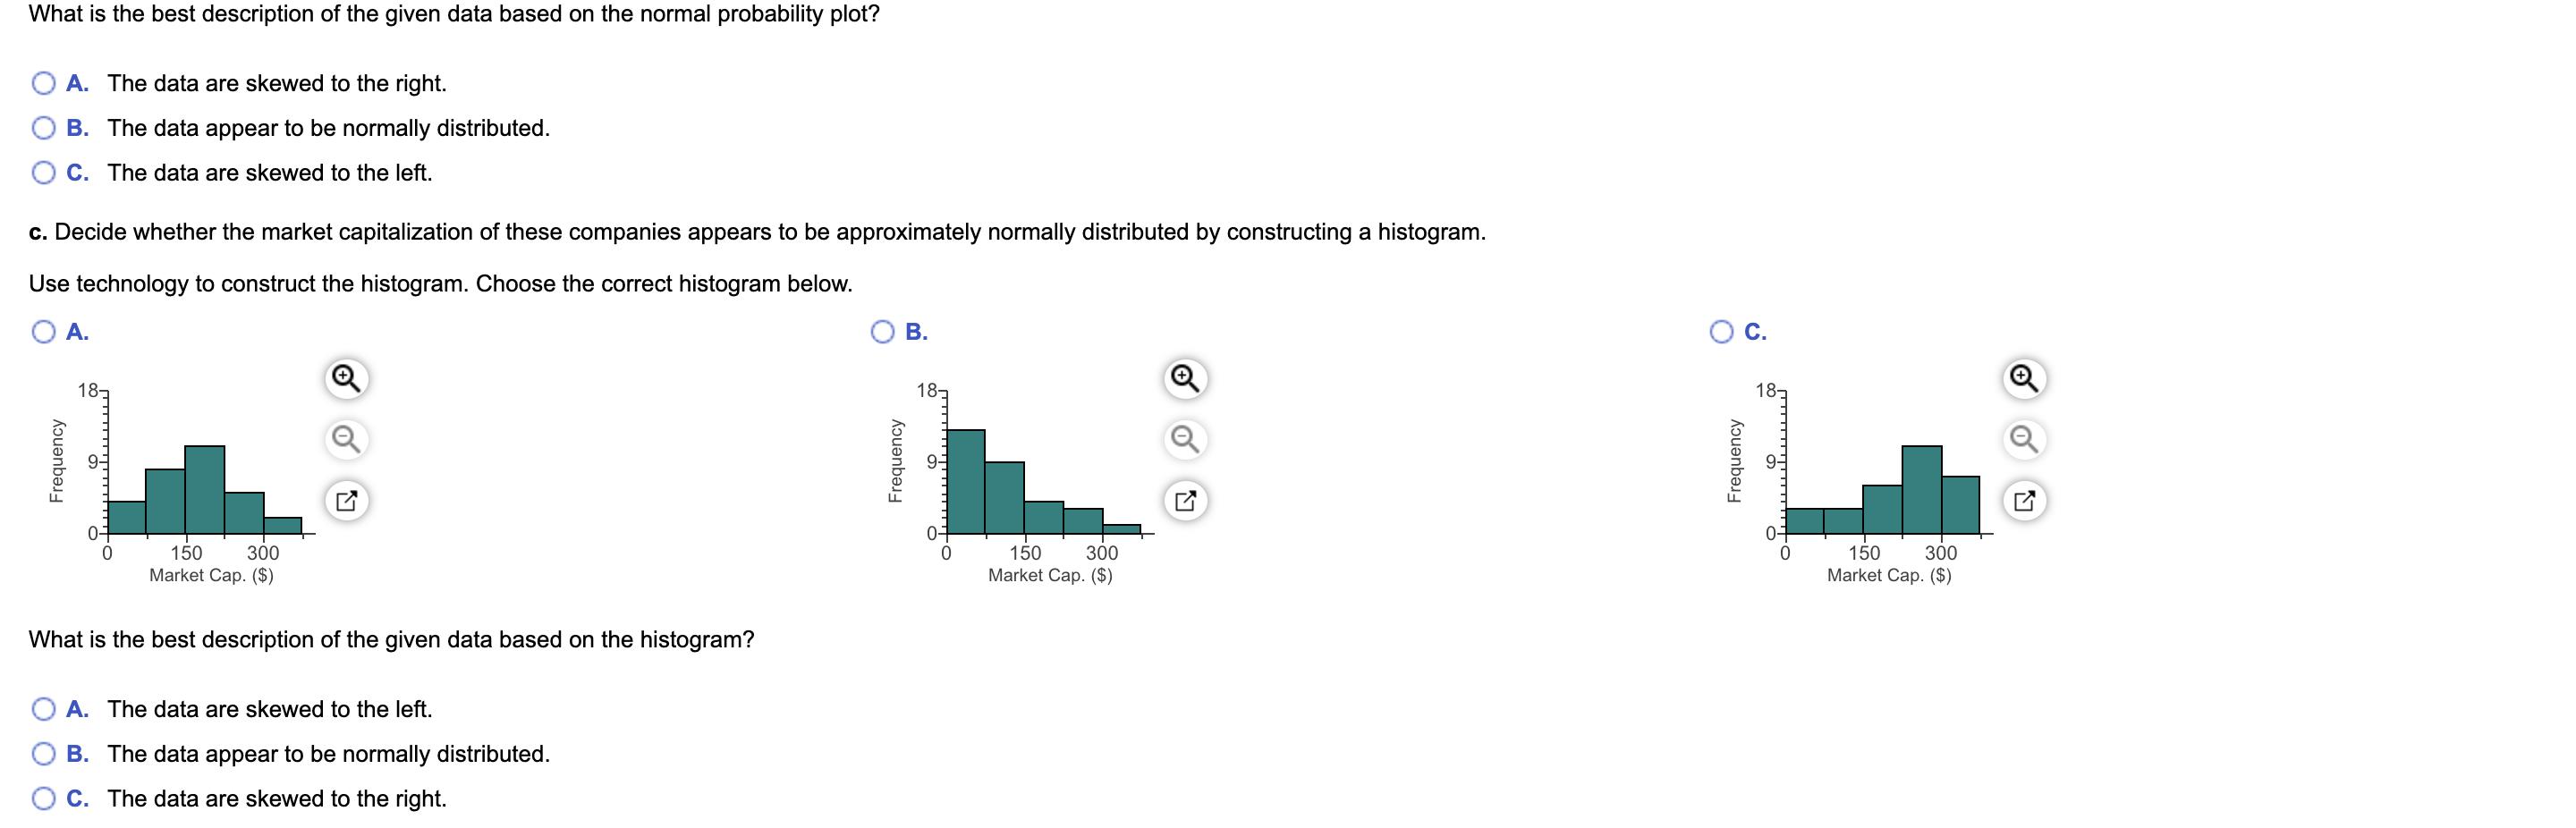
One common method for measuring the size of a company is to use its market capitalization,...
Fantastic news! We've Found the answer you've been seeking!
Question:
Transcribed Image Text:
One common method for measuring the size of a company is to use its market capitalization, which is computed by multiplying the number of stock shares by the price of a share of stock. The data set below contains the market capitalization values, In dollars, for 30 companies. Complete parts (a) through (c). 45.3 57.4 40.6 24.1 133.5 147.6 31.0 99.0 80.2 76.2 e 258.4 50.8 321.0 33.9 32.0 105.4 19.6 19.1 176.2 49.6 184.8 122.8 211.2 263.7 60.7 77.5 200.3 291.9 122.0 18.0 a. Decide whether the market capitallization of these companies appears to be approximately normally distributed by comparing data characteristics to theoretical propertles. Based on the theoretical properties of the normal distribution, do the data appear to be approximately normally distributed? O Yes, the distribution of the data appears to closely resemble a normal distribution. O No, because there are a significant number of outliers in the data. O No, the distribution of the data is significantly skewed to the right. O No, the distribution of the data is significantly skewed to the left. b. Decide whether the market capitalization of these companies appears to be approximately normally distributed by constructing a normal probability plot. Use technology o construct the nomal probability plot. Choose the corect graph below. O A OB. 350- 175 175 175 7-valae What is the best description of the given data based on the normal probability plot? What is the best description of the given data based on the normal probability plot? A. The data are skewed to the right. B. The data appear to be normally distributed. C. The data are skewed to the left. c. Decide whether the market capitalization of these companies appears to be approximately normally distributed by constructing a histogram. Use technology to construct the histogram. Choose the correct histogram below. O A. В. O C. 18- 18- 18- 150 Market Cap. ($) 300 150 Market Cap. ($) 300 150 Market Cap. ($) 300 What is the best description of the given data based on the histogram? A. The data are skewed to the left. B. The data appear to be normally distributed. O c. The data are skewed to the right. Frequency Frequency Frequency One common method for measuring the size of a company is to use its market capitalization, which is computed by multiplying the number of stock shares by the price of a share of stock. The data set below contains the market capitalization values, In dollars, for 30 companies. Complete parts (a) through (c). 45.3 57.4 40.6 24.1 133.5 147.6 31.0 99.0 80.2 76.2 e 258.4 50.8 321.0 33.9 32.0 105.4 19.6 19.1 176.2 49.6 184.8 122.8 211.2 263.7 60.7 77.5 200.3 291.9 122.0 18.0 a. Decide whether the market capitallization of these companies appears to be approximately normally distributed by comparing data characteristics to theoretical propertles. Based on the theoretical properties of the normal distribution, do the data appear to be approximately normally distributed? O Yes, the distribution of the data appears to closely resemble a normal distribution. O No, because there are a significant number of outliers in the data. O No, the distribution of the data is significantly skewed to the right. O No, the distribution of the data is significantly skewed to the left. b. Decide whether the market capitalization of these companies appears to be approximately normally distributed by constructing a normal probability plot. Use technology o construct the nomal probability plot. Choose the corect graph below. O A OB. 350- 175 175 175 7-valae What is the best description of the given data based on the normal probability plot? What is the best description of the given data based on the normal probability plot? A. The data are skewed to the right. B. The data appear to be normally distributed. C. The data are skewed to the left. c. Decide whether the market capitalization of these companies appears to be approximately normally distributed by constructing a histogram. Use technology to construct the histogram. Choose the correct histogram below. O A. В. O C. 18- 18- 18- 150 Market Cap. ($) 300 150 Market Cap. ($) 300 150 Market Cap. ($) 300 What is the best description of the given data based on the histogram? A. The data are skewed to the left. B. The data appear to be normally distributed. O c. The data are skewed to the right. Frequency Frequency Frequency
Expert Answer:
Answer rating: 100% (QA)
a No the distribution of the data is significantly ... View the full answer
Related Book For
Probability & Statistics for Engineers & Scientists
ISBN: 978-0130415295
7th Edition
Authors: Ronald E. Walpole, Raymond H. Myers, Sharon L. Myers, Keying
Posted Date:
Students also viewed these accounting questions
-
Complete parts a through c below for the continuous data in the accompanying table. Click the icon to view the data table. a) Construct a frequency distribution using the 2" zn rule. Select the...
-
In which ways does the size of a customers business affect business behavior?
-
A $10,000 investment on the books of a company is sold for $9,000. Under the indirect method, how does this transaction affect operating, investing, and financing activities?
-
Suppose that there is parity between the Australian dollar and the United States dollar. Let x be a positive number and assume that the United States dollar increases by 100x % in Australian dollars....
-
For a long- lived operating asset acquired by issuing a note payable, do firms measure the initial carrying value of the asset by the face value of the note? Explain.
-
Suppose that at the beginning of a year, the price of corn is $3.80 per bushel and 14 billion bushels are harvested. There are approximately 400,000 corn farmers, so the average output per farmer is...
-
Following are errors, frauds, or other circumstances that an auditor might encounter as a result of applying audit tests to investments as of the balance sheet date: a. The client does not maintain...
-
Shanna Engel started up a new nonprofit organization in 2013 named Concern for Animal Shelter and Habitats (CASH). The organization places homeless animals in permanent homes. Transactions during the...
-
Zion, Inc. has one employee who has worked January - June of the current year. The employee is single, paid weekly, and claims two allowances on her W-2. The company is in a state that has no state...
-
Using the Public MACRO BITCOIN scorecard spreadsheet (linked in its associated masterclass lesson - Long Term 32), create a COPY of it and perform a complete analysis for the date 22/2/2022....
-
Dominique, age 70, has just retired. She is not interested in the stock market and explains that she would like to structure a stable income stream for herself in retirement. However, a high priority...
-
According to some sources, the night the ship Titanic sank the time between the order to turn \"hard to starboard\" and the collision was 4 6 seconds. At this time Titanic was speeding at 2 2 . 5...
-
Add three vectors A, B, and C, where R=A+B+C. Calculate the Y-component of the resulant. A=27.8 m/s at 159.4 degrees from the positive X-axis B=35.2 m/s at 340.3 degrees from the positive X-axis...
-
Three capacitors ???? 1 = 1 1 . 8 ???? ???? , ???? 2 = 1 5 . 0 ???? ???? , and ???? 3 = 2 9 . 3 ???? ???? are connected in series. To avoid breakdown of the capacitors, the maximum potential...
-
Using the tables in Exhibits 26-3 and 26-4, determine the present value of the following cash flows, discounted at an annual rate of 15 percent. (Round "PV factors" to 3 decimal places. Do not round...
-
Scenario You are a member of the strategic planning department at Ceiling and Visibility Unlimited (CAVU) Innovations, the current leading designer of senior citizen communication technologies. The...
-
An unstable particle at rest breaks up into two fragments of unequal mass. The mass of the lighter fragment is equal to 2.30 x 10 -28 kg and that of the heavier fragment is 1.70 x 10 -27 kg. If the...
-
A report from the college dean indicates that for the previous semester, the grade distribution for the Department of Psychology included 135 As, 158 Bs, 140 Cs, 94 Ds, and 53 Fs. Determine what kind...
-
Five independent coin tosses result in HIIHHII. It turns out that if the coin is fair the probability of this outcome is (l/2)5 = 0.03125. Does this produce strong evidence that the coin is not fair?...
-
A regression model is desired relating temperature and the proportion of impurity from a solid substance passing through solid helium. Temperature is listed in degrees centigrade. The data are as...
-
In a study conducted by the Department of Mechanical Engineering and analyzed by the Statistics Consulting Center at the Virginia Polytechnic Institute and State University, the steel rods supplied...
-
Solve Chapter Problem 13.21, assuming the power spectral density is band limited with \(\omega_{1}=50 \mathrm{rad} / \mathrm{s}\) and \(\omega_{2}=200 \mathrm{rad} / \mathrm{s}\). Data From Chapter...
-
Solve Chapter Problem 13.21, assuming the force is narrowband with a power spectral density given by \(S_{F}(\omega)=\frac{3 \times 10^{-3}}{2+5 \omega^{2}}\). Data From Chapter Problem 13.21: A SDOF...
-
Fine Leather Ltd has provided the following production and sales information for each pair of its dress shoes. The fixed costs for the period are \($1\) 125 000. Required (a) Calculate the...
Study smarter with the SolutionInn App