

Question: one mountain', Lake.' Each small multiple plot will be a line chart corresponding to the conditional probability over time. The matrix cell indicates which pairs
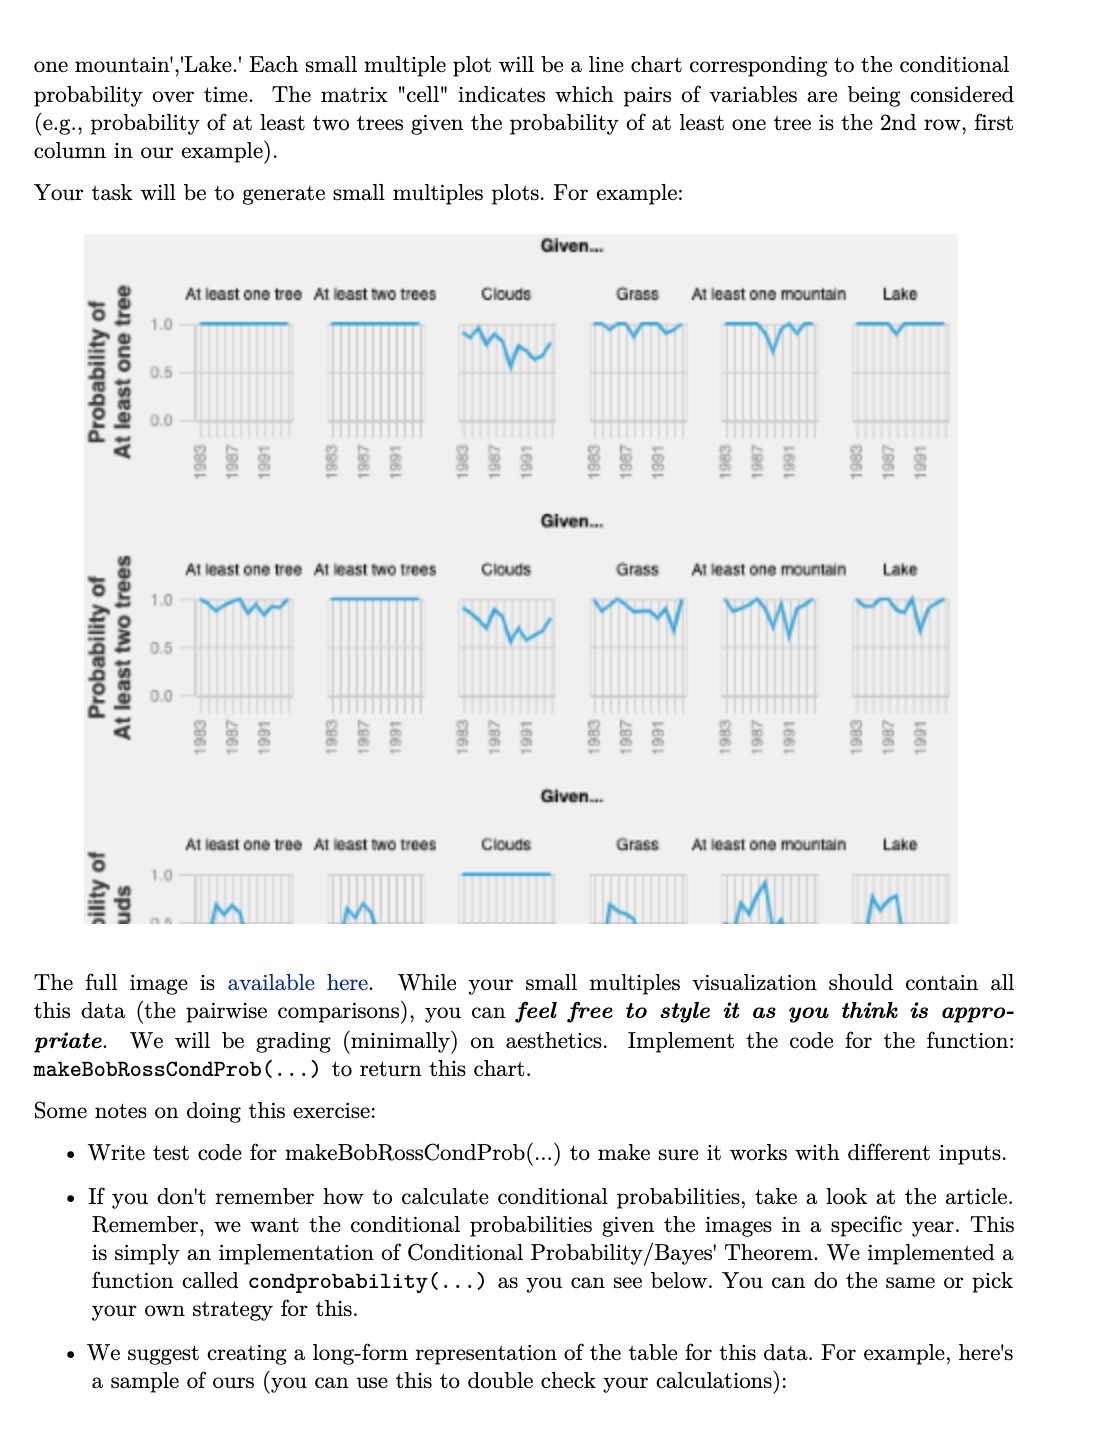

one mountain', Lake.' Each small multiple plot will be a line chart corresponding to the conditional probability over time. The matrix "cell" indicates which pairs of variables are being considered (e.g., probability of at least two trees given the probability of at least one tree is the 2nd row, first column in our example). Your task will be to generate small multiples plots. For example: Given.. At least one tree At least two trees Clouds Grass At least one mountain Lake 1.0 At least one tree Probability of 0.6 0.C 1983 1987 1991 Given... At least one tree At least two trees Clouds Grass At least one mountain Lake 1.0 At least two trees Probability of 0.5 1983 1987 1991 3 8 8 8 8 8 Given... At least one tree At least two trees Clouds Grass At least one mountain Lake 1.0 bility of uds M The full image is available here. While your small multiples visualization should contain all this data (the pairwise comparisons), you can feel free to style it as you think is appro- priate. We will be grading (minimally) on aesthetics. Implement the code for the function: makeBobRossCondProb (. . .) to return this chart. Some notes on doing this exercise: . Write test code for makeBobRossCondProb(...) to make sure it works with different inputs. . If you don't remember how to calculate conditional probabilities, take a look at the article. Remember, we want the conditional probabilities given the images in a specific year. This is simply an implementation of Conditional Probability /Bayes' Theorem. We implemented a function called condprobability (. ..) as you can see below. You can do the same or pick your own strategy for this. . We suggest creating a long-form representation of the table for this data. For example, here's a sample of ours (you can use this to double check your calculations)
Step by Step Solution
There are 3 Steps involved in it

Get step-by-step solutions from verified subject matter experts