

Question: People spend a lot of money on bottled water. But do they really prefer bottled water to ordinary tap water? Researchers at Longwood University
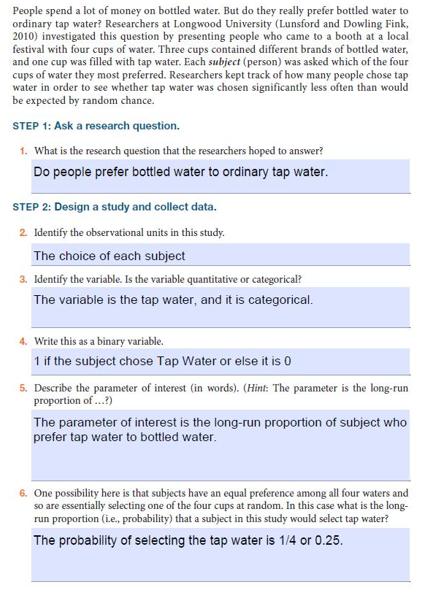
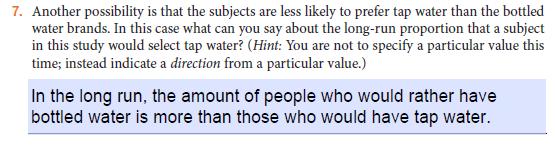
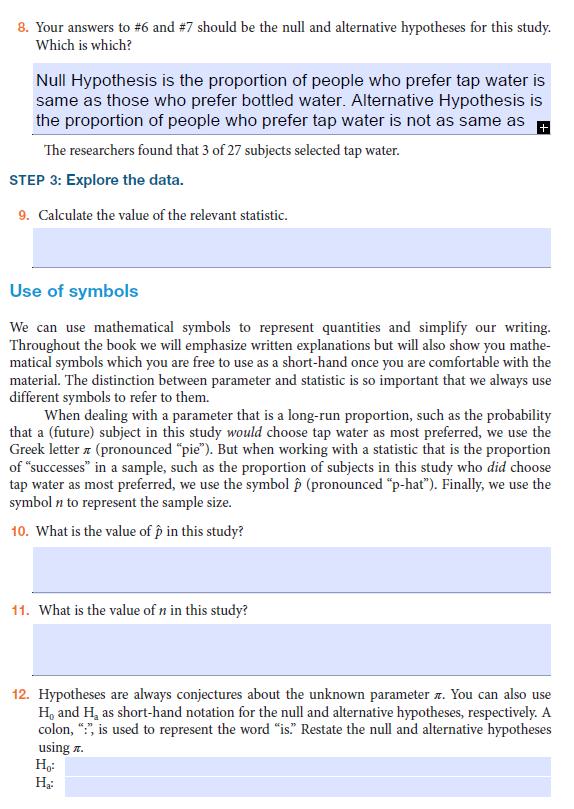
People spend a lot of money on bottled water. But do they really prefer bottled water to ordinary tap water? Researchers at Longwood University (Lunsford and Dowling Fink, 2010) investigated this question by presenting people who came to a booth at a local festival with four cups of water. Three cups contained different brands of bottled water, and one cup was filled with tap water. Each subject (person) was asked which of the four cups of water they most preferred. Researchers kept track of how many people chose tap water in order to see whether tap water was chosen significantly less often than would be expected by random chance. STEP 1: Ask a research question. 1. What is the research question that the researchers hoped to answer? Do people prefer bottled water to ordinary tap water. STEP 2: Design a study and collect data. 2. Identify the observational units in this study. The choice of each subject 3. Identify the variable. Is the variable quantitative or categorical? The variable is the tap water, and it is categorical. Write this as a binary variable. 1 if the subject chose Tap Water or else it is 0 5. Describe the parameter of interest (in words). (Hint: The parameter is the long-run proportion of...?) The parameter of interest is the long-run proportion of subject who prefer tap water to bottled water. 6. One possibility here is that subjects have an equal preference among all four waters and so are essentially selecting one of the four cups at random. In this case what is the long- run proportion (i.e., probability) that a subject in this study would select tap water? The probability of selecting the tap water is 1/4 or 0.25. 7. Another possibility is that the subjects are less likely to prefer tap water than the bottled water brands. In this case what can you say about the long-run proportion that a subject in this study would select tap water? (Hint: You are not to specify a particular value this time; instead indicate a direction from a particular value.) In the long run, the amount of people who would rather have bottled water is more than those who would have tap water. 8. Your answers to #6 and #7 should be the null and alternative hypotheses for this study. Which is which? Null Hypothesis is the proportion of people who prefer tap water is same as those who prefer bottled water. Alternative Hypothesis is the proportion of people who prefer tap water is not as same as The researchers found that 3 of 27 subjects selected tap water. STEP 3: Explore the data. 9. Calculate the value of the relevant statistic. Use of symbols We can use mathematical symbols to represent quantities and simplify our writing. Throughout the book we will emphasize written explanations but will also show you mathe- matical symbols which you are free to use as a short-hand once you are comfortable with the material. The distinction between parameter and statistic is so important that we always use different symbols to refer to them. When dealing with a parameter that is a long-run proportion, such as the probability that a (future) subject in this study would choose tap water as most preferred, we use the Greek letter (pronounced "pie"). But when working with a statistic that is the proportion of "successes" in a sample, such as the proportion of subjects in this study who did choose tap water as most preferred, we use the symbol p (pronounced "p-hat"). Finally, we use the symbol n to represent the sample size. 10. What is the value of p in this study? 11. What is the value of n in this study? 12. Hypotheses are always conjectures about the unknown parameter . You can also use H, and H as short-hand notation for the null and alternative hypotheses, respectively. A colon, "", is used to represent the word "is." Restate the null and alternative hypotheses using z. Ho: H: STEP 4: Draw inferences. 13. Is the sample proportion who selected tap water in this study less than the probability specified in the null hypothesis? 14. Is it possible that this proportion could turn out to be this small even if the null hypothesis was true (Le., even if people did not really dislike the tap water and were essentially select- ing at random from among the four cups)? As we did with Buzz and Doris in Section 1.1, we will use simulation to investigate how surprising the observed sample result (3 of 27 selecting tap water) would be if in fact subjects did not dislike tap water and so each had a 1/4 probability of selecting tap water. (Note also that our null model assumes the same probability for all subjects.) THINK ABOUT IT Can we use a coin to represent the chance model specified by the null hypothesis like before? It not, can you suggest a different random device we could use? What needs to be different about our simulation this time? 15. Explain why we cannot use a simple coin toss to simulate the subjects' choices, as we did with the Buzz/Doris study. 16. We could do the simulation using a set of four playing cards: one black and three red. Explain how the simulation would work in this case. 17. Another option would be to use a spinner like the one shown here like you would use when playing a child's board game. Explain how the simulation would work if you were using a spinner. In particular: a. What does each region represent? b. How many spins of the spinner will you need to do in order to simulate one repetition of the experiment when there is equal preference between the four waters (null hypothesis is true)? 18. We will now use the One Proportion applet to conduct this simulation analysis. Notice that the applet will show us what it would be like if we were simulating with spinners. a. First enter the probability of heads/probability of success value specified in the null hypothesis. People spend a lot of money on bottled water. But do they really prefer bottled water to ordinary tap water? Researchers at Longwood University (Lunsford and Dowling Fink, 2010) investigated this question by presenting people who came to a booth at a local festival with four cups of water. Three cups contained different brands of bottled water, and one cup was filled with tap water. Each subject (person) was asked which of the four cups of water they most preferred. Researchers kept track of how many people chose tap water in order to see whether tap water was chosen significantly less often than would be expected by random chance. STEP 1: Ask a research question. 1. What is the research question that the researchers hoped to answer? Do people prefer bottled water to ordinary tap water. STEP 2: Design a study and collect data. 2. Identify the observational units in this study. The choice of each subject 3. Identify the variable. Is the variable quantitative or categorical? The variable is the tap water, and it is categorical. Write this as a binary variable. 1 if the subject chose Tap Water or else it is 0 5. Describe the parameter of interest (in words). (Hint: The parameter is the long-run proportion of...?) The parameter of interest is the long-run proportion of subject who prefer tap water to bottled water. 6. One possibility here is that subjects have an equal preference among all four waters and so are essentially selecting one of the four cups at random. In this case what is the long- run proportion (i.e., probability) that a subject in this study would select tap water? The probability of selecting the tap water is 1/4 or 0.25. 7. Another possibility is that the subjects are less likely to prefer tap water than the bottled water brands. In this case what can you say about the long-run proportion that a subject in this study would select tap water? (Hint: You are not to specify a particular value this time; instead indicate a direction from a particular value.) In the long run, the amount of people who would rather have bottled water is more than those who would have tap water. 8. Your answers to #6 and #7 should be the null and alternative hypotheses for this study. Which is which? Null Hypothesis is the proportion of people who prefer tap water is same as those who prefer bottled water. Alternative Hypothesis is the proportion of people who prefer tap water is not as same as The researchers found that 3 of 27 subjects selected tap water. STEP 3: Explore the data. 9. Calculate the value of the relevant statistic. Use of symbols We can use mathematical symbols to represent quantities and simplify our writing. Throughout the book we will emphasize written explanations but will also show you mathe- matical symbols which you are free to use as a short-hand once you are comfortable with the material. The distinction between parameter and statistic is so important that we always use different symbols to refer to them. When dealing with a parameter that is a long-run proportion, such as the probability that a (future) subject in this study would choose tap water as most preferred, we use the Greek letter (pronounced "pie"). But when working with a statistic that is the proportion of "successes" in a sample, such as the proportion of subjects in this study who did choose tap water as most preferred, we use the symbol p (pronounced "p-hat"). Finally, we use the symbol n to represent the sample size. 10. What is the value of p in this study? 11. What is the value of n in this study? 12. Hypotheses are always conjectures about the unknown parameter . You can also use H, and H as short-hand notation for the null and alternative hypotheses, respectively. A colon, "", is used to represent the word "is." Restate the null and alternative hypotheses using z. Ho: H: STEP 4: Draw inferences. 13. Is the sample proportion who selected tap water in this study less than the probability specified in the null hypothesis? 14. Is it possible that this proportion could turn out to be this small even if the null hypothesis was true (Le., even if people did not really dislike the tap water and were essentially select- ing at random from among the four cups)? As we did with Buzz and Doris in Section 1.1, we will use simulation to investigate how surprising the observed sample result (3 of 27 selecting tap water) would be if in fact subjects did not dislike tap water and so each had a 1/4 probability of selecting tap water. (Note also that our null model assumes the same probability for all subjects.) THINK ABOUT IT Can we use a coin to represent the chance model specified by the null hypothesis like before? It not, can you suggest a different random device we could use? What needs to be different about our simulation this time? 15. Explain why we cannot use a simple coin toss to simulate the subjects' choices, as we did with the Buzz/Doris study. 16. We could do the simulation using a set of four playing cards: one black and three red. Explain how the simulation would work in this case. 17. Another option would be to use a spinner like the one shown here like you would use when playing a child's board game. Explain how the simulation would work if you were using a spinner. In particular: a. What does each region represent? b. How many spins of the spinner will you need to do in order to simulate one repetition of the experiment when there is equal preference between the four waters (null hypothesis is true)? 18. We will now use the One Proportion applet to conduct this simulation analysis. Notice that the applet will show us what it would be like if we were simulating with spinners. a. First enter the probability of heads/probability of success value specified in the null hypothesis. People spend a lot of money on bottled water. But do they really prefer bottled water to ordinary tap water? Researchers at Longwood University (Lunsford and Dowling Fink, 2010) investigated this question by presenting people who came to a booth at a local festival with four cups of water. Three cups contained different brands of bottled water, and one cup was filled with tap water. Each subject (person) was asked which of the four cups of water they most preferred. Researchers kept track of how many people chose tap water in order to see whether tap water was chosen significantly less often than would be expected by random chance. STEP 1: Ask a research question. 1. What is the research question that the researchers hoped to answer? Do people prefer bottled water to ordinary tap water. STEP 2: Design a study and collect data. 2. Identify the observational units in this study. The choice of each subject 3. Identify the variable. Is the variable quantitative or categorical? The variable is the tap water, and it is categorical. Write this as a binary variable. 1 if the subject chose Tap Water or else it is 0 5. Describe the parameter of interest (in words). (Hint: The parameter is the long-run proportion of...?) The parameter of interest is the long-run proportion of subject who prefer tap water to bottled water. 6. One possibility here is that subjects have an equal preference among all four waters and so are essentially selecting one of the four cups at random. In this case what is the long- run proportion (i.e., probability) that a subject in this study would select tap water? The probability of selecting the tap water is 1/4 or 0.25. 7. Another possibility is that the subjects are less likely to prefer tap water than the bottled water brands. In this case what can you say about the long-run proportion that a subject in this study would select tap water? (Hint: You are not to specify a particular value this time; instead indicate a direction from a particular value.) In the long run, the amount of people who would rather have bottled water is more than those who would have tap water. 8. Your answers to #6 and #7 should be the null and alternative hypotheses for this study. Which is which? Null Hypothesis is the proportion of people who prefer tap water is same as those who prefer bottled water. Alternative Hypothesis is the proportion of people who prefer tap water is not as same as The researchers found that 3 of 27 subjects selected tap water. STEP 3: Explore the data. 9. Calculate the value of the relevant statistic. Use of symbols We can use mathematical symbols to represent quantities and simplify our writing. Throughout the book we will emphasize written explanations but will also show you mathe- matical symbols which you are free to use as a short-hand once you are comfortable with the material. The distinction between parameter and statistic is so important that we always use different symbols to refer to them. When dealing with a parameter that is a long-run proportion, such as the probability that a (future) subject in this study would choose tap water as most preferred, we use the Greek letter (pronounced "pie"). But when working with a statistic that is the proportion of "successes" in a sample, such as the proportion of subjects in this study who did choose tap water as most preferred, we use the symbol p (pronounced "p-hat"). Finally, we use the symbol n to represent the sample size. 10. What is the value of p in this study? 11. What is the value of n in this study? 12. Hypotheses are always conjectures about the unknown parameter . You can also use H, and H as short-hand notation for the null and alternative hypotheses, respectively. A colon, "", is used to represent the word "is." Restate the null and alternative hypotheses using z. Ho: H: STEP 4: Draw inferences. 13. Is the sample proportion who selected tap water in this study less than the probability specified in the null hypothesis? 14. Is it possible that this proportion could turn out to be this small even if the null hypothesis was true (Le., even if people did not really dislike the tap water and were essentially select- ing at random from among the four cups)? As we did with Buzz and Doris in Section 1.1, we will use simulation to investigate how surprising the observed sample result (3 of 27 selecting tap water) would be if in fact subjects did not dislike tap water and so each had a 1/4 probability of selecting tap water. (Note also that our null model assumes the same probability for all subjects.) THINK ABOUT IT Can we use a coin to represent the chance model specified by the null hypothesis like before? It not, can you suggest a different random device we could use? What needs to be different about our simulation this time? 15. Explain why we cannot use a simple coin toss to simulate the subjects' choices, as we did with the Buzz/Doris study. 16. We could do the simulation using a set of four playing cards: one black and three red. Explain how the simulation would work in this case. 17. Another option would be to use a spinner like the one shown here like you would use when playing a child's board game. Explain how the simulation would work if you were using a spinner. In particular: a. What does each region represent? b. How many spins of the spinner will you need to do in order to simulate one repetition of the experiment when there is equal preference between the four waters (null hypothesis is true)? 18. We will now use the One Proportion applet to conduct this simulation analysis. Notice that the applet will show us what it would be like if we were simulating with spinners. a. First enter the probability of heads/probability of success value specified in the null hypothesis.
Step by Step Solution
3.41 Rating (148 Votes )
There are 3 Steps involved in it
1 What is the research question that the researchers hoped to answer The research question that was posed by the researchers was to determine whether people prefer bottled water to ordinary tap water ... View full answer

Get step-by-step solutions from verified subject matter experts