

Question: One problem I tried to get through was understanding how to pick the right hypothesis. This was hard because the words sounded very similar and
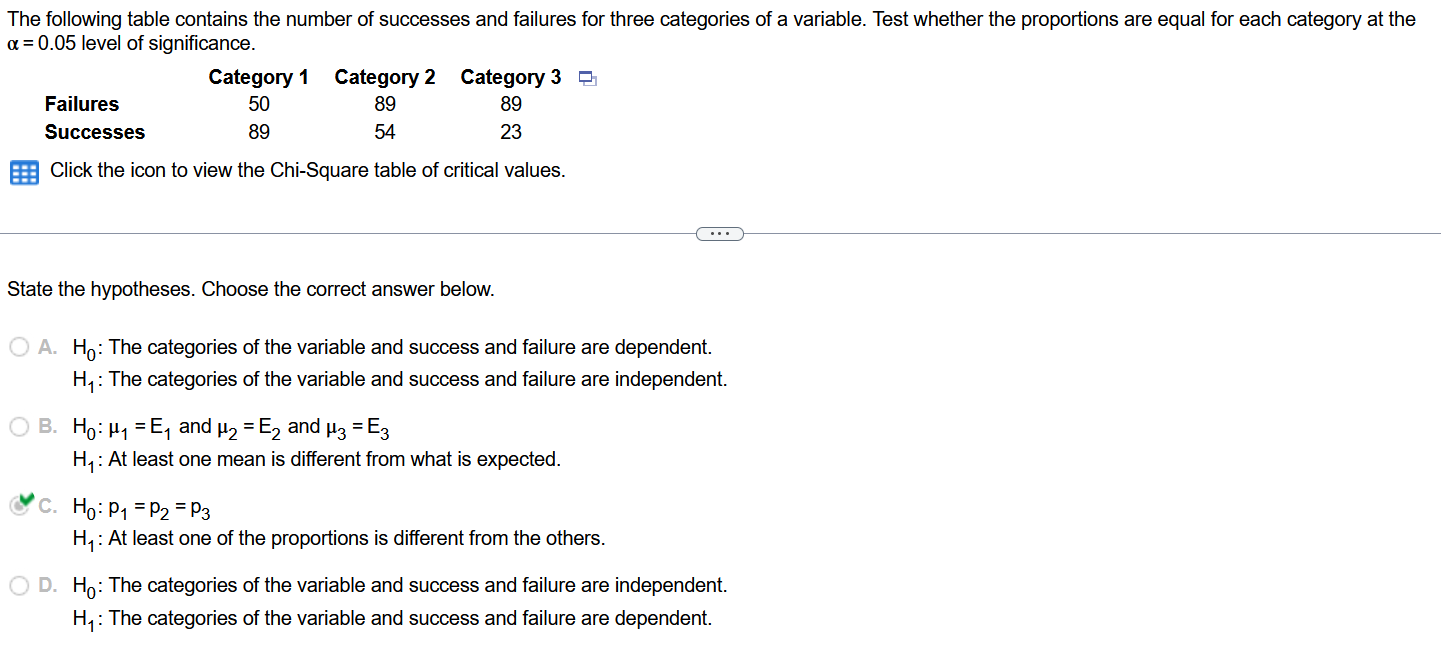
One problem I tried to get through was understanding how to pick the right hypothesis. This was hard because the words sounded very similar and a bit confusing. I had to read them slowly to see the small differences. In the end, I picked the one that said the proportions are equal because it made the most sense for this question. I tried to add up the failures and successes for each category to get the totals. For Category 1, I added 50 failures and 89 successes to get 139. For Category 2, I added 89 failures and 54 successes to get 143. For Category 3, I added 89 failures and 23 successes to get 112.Next, I added up all the failures and all the successes to find the overall totals. The total number of failures was 50 + 89 + 89 = 228, and the total number of successes was 89 + 54 + 23 = 166. The grand total for everything was 228 + 166 = 394.Then, I tried to figure out the expected numbers for each category by using the formula: (row total column total) divided by the grand total. For example, for Category 1 successes, I did (139 166) 394, which gave me about 58.5. I tried doing this for the other categories too, but it got a little confusing to keep track of all the numbers.
Step by Step Solution
There are 3 Steps involved in it

Get step-by-step solutions from verified subject matter experts