

Question: One - Sample t test 6.55 Surface roughness of pipe. Refer to the Anti-corrosion Methods and Materials (Vol. 50, 2003) study of the surface roughness
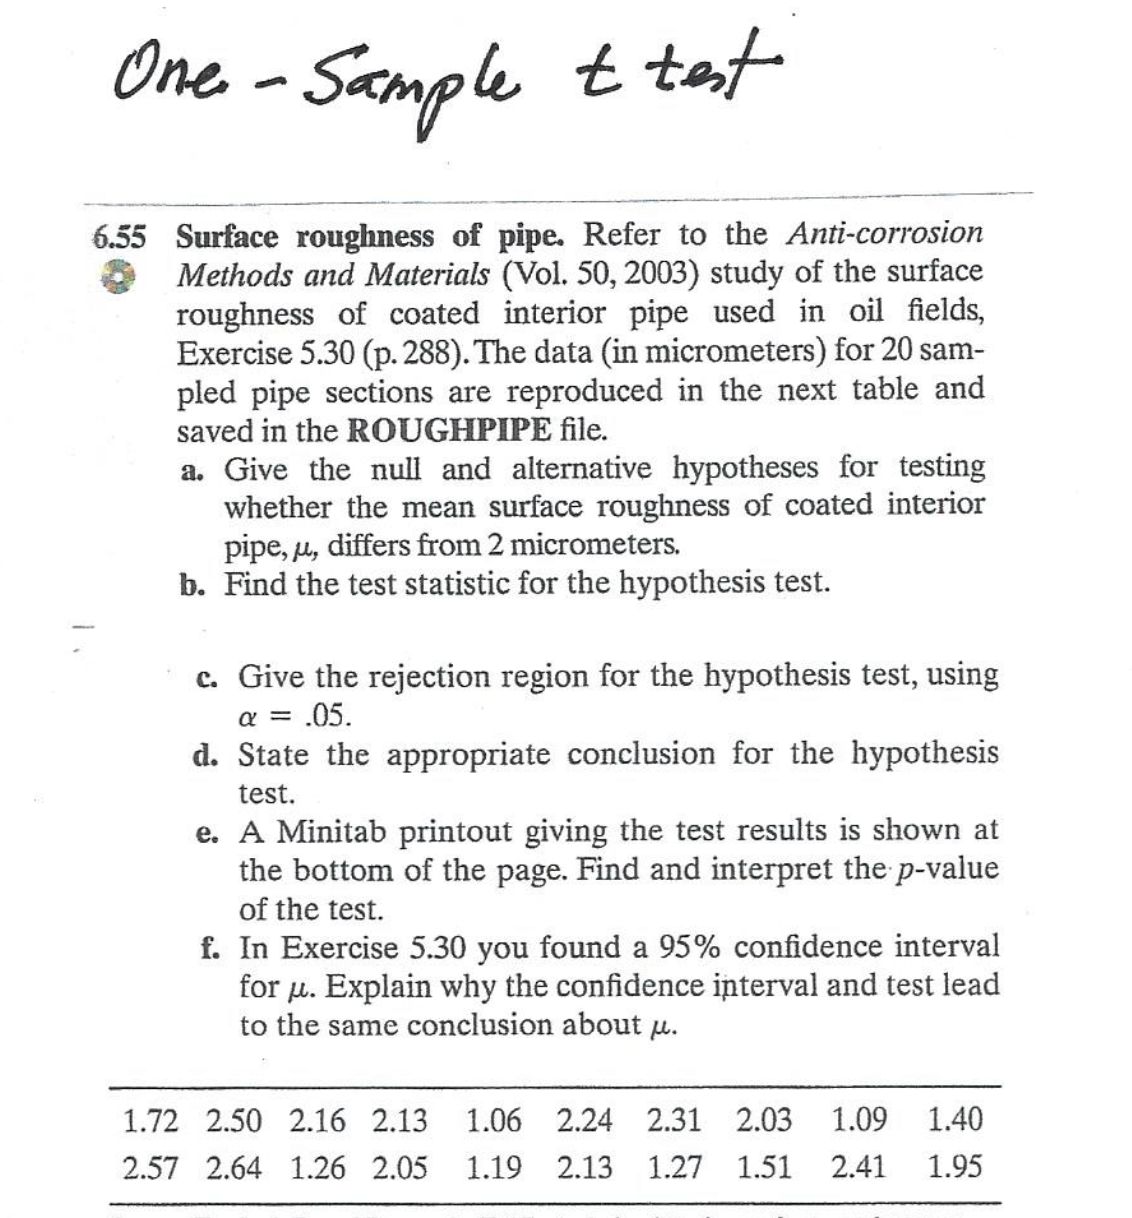
One - Sample t test 6.55 Surface roughness of pipe. Refer to the Anti-corrosion Methods and Materials (Vol. 50, 2003) study of the surface roughness of coated interior pipe used in oil fields, Exercise 5.30 (p. 288). The data (in micrometers) for 20 sam- pled pipe sections are reproduced in the next table and saved in the ROUGHPIPE file. a. Give the null and alternative hypotheses for testing whether the mean surface roughness of coated interior pipe, ju, differs from 2 micrometers. b. Find the test statistic for the hypothesis test. c. Give the rejection region for the hypothesis test, using a = .05. d. State the appropriate conclusion for the hypothesis test. e. A Minitab printout giving the test results is shown at the bottom of the page. Find and interpret the p-value of the test. f. In Exercise 5.30 you found a 95% confidence interval for u. Explain why the confidence interval and test lead to the same conclusion about u. 1.72 2.50 2.16 2.13 1.06 2.24 2.31 2.03 1.09 1.40 2.57 2.64 1.26 2.05 1.19 2.13 1.27 1.51 2.41 1.95
Step by Step Solution
There are 3 Steps involved in it

Get step-by-step solutions from verified subject matter experts