

Question: One semester, the TA for a math class decided to time how long it took her students to finish their Final Exam. Below is
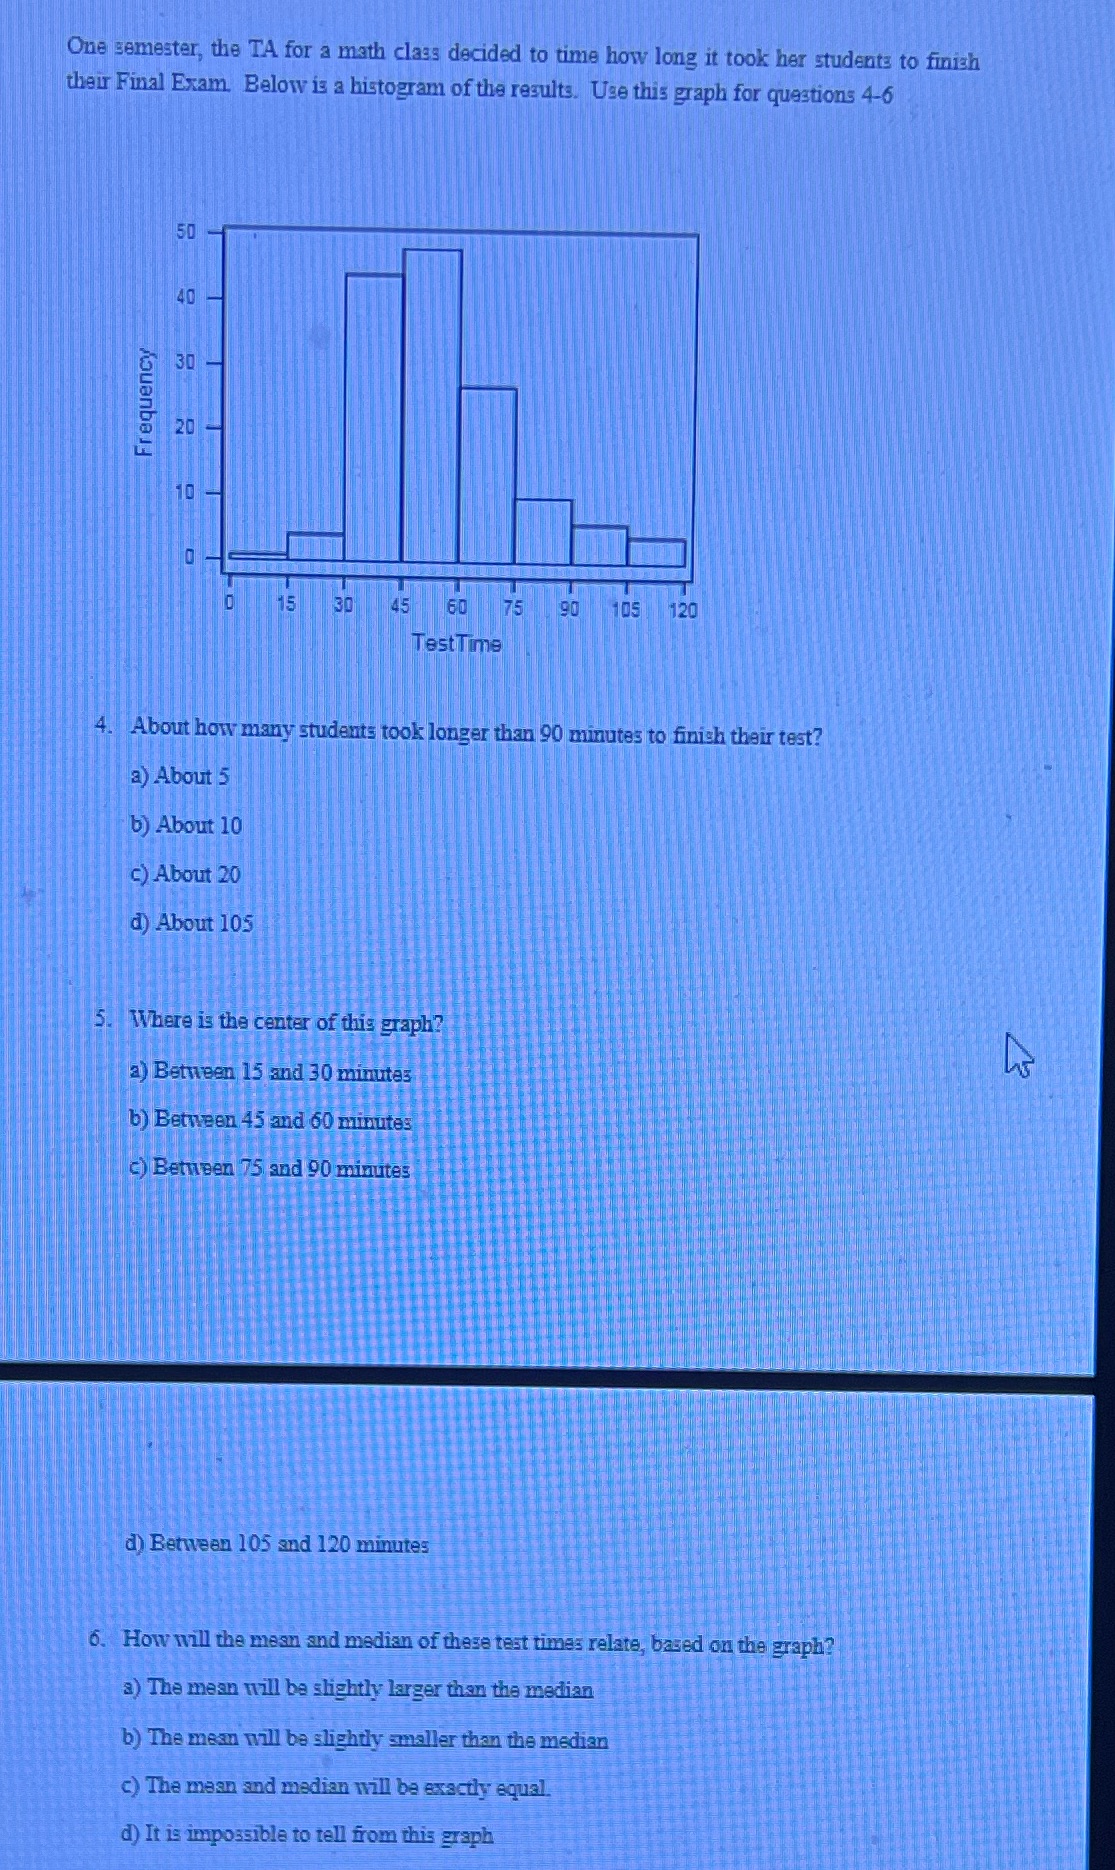
One semester, the TA for a math class decided to time how long it took her students to finish their Final Exam. Below is a histogram of the results. Use this graph for questions 4-6 50 50 no 40 30 Frequency 20 20 10 D D 475 - 75 90 105 120 15 30 45 60 TestTime 4. About how many students took longer than 90 minutes to finish their test? a) About 5 b) About 10 c) About 20 d) About 105 5. Where is the center of this graph? a) Between 15 and 30 minutes b) Between 45 and 60 minutes c) Between 75 and 90 minutes d) Between 105 and 120 minutes 13 6. How will the mean and median of these test times relate, based on the graph? a) The mean will be slightly larger than the median b) The mean will be slightly smaller than the median c) The mean and median will be exactly equal. d) It is impossible to tell from this graph
Step by Step Solution
There are 3 Steps involved in it

Get step-by-step solutions from verified subject matter experts