

Question: One year Perry had the lowest ERA (earned-run average, mean number of runs yielded per nine innings pitched) of any male pitcher at his

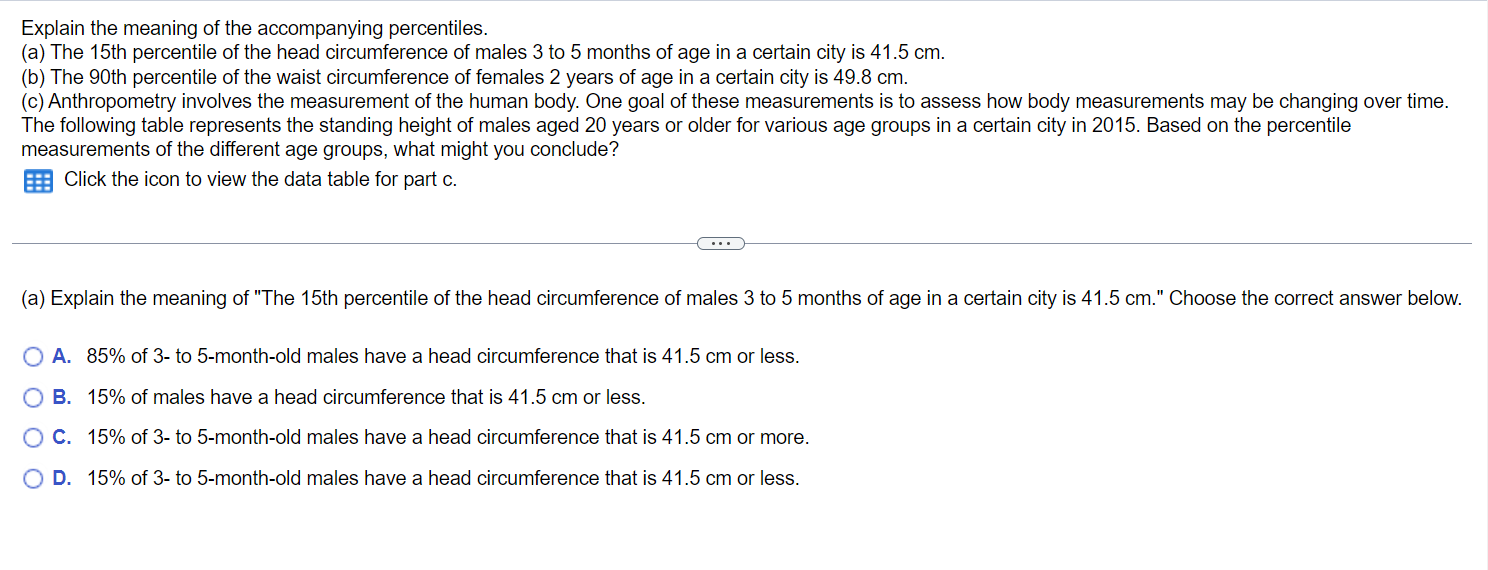
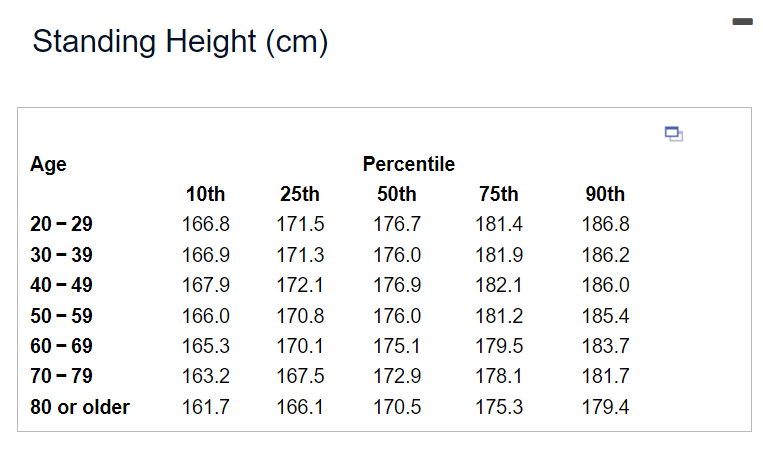
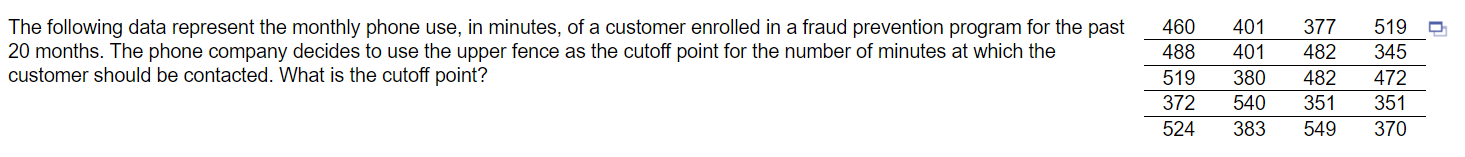

One year Perry had the lowest ERA (earned-run average, mean number of runs yielded per nine innings pitched) of any male pitcher at his school, with an ERA of 2.83. Also, Sally had the lowest ERA of any female pitcher at the school with an ERA of 3.43. For the males, the mean ERA was 5.078 and the standard deviation was 0.805. For the females, the mean ERA was 4.334 and the standard deviation was 0.767. Find their respective z-scores. Which player had the better year relative to their peers, Perry or Sally? (Note: In general, the lower the ERA, the better the pitcher.) Explain the meaning of the accompanying percentiles. (a) The 15th percentile of the head circumference of males 3 to 5 months of age in a certain city is 41.5 cm. (b) The 90th percentile of the waist circumference of females 2 years of age in a certain city is 49.8 cm. (c) Anthropometry involves the measurement of the human body. One goal of these measurements is to assess how body measurements may be changing over time. The following table represents the standing height of males aged 20 years or older for various age groups in a certain city in 2015. Based on the percentile measurements of the different age groups, what might you conclude? Click the icon to view the data table for part c. (a) Explain the meaning of "The 15th percentile of the head circumference of males 3 to 5 months of age in a certain city is 41.5 cm." Choose the correct answer below. A. 85% of 3- to 5-month-old males have a head circumference that is 41.5 cm or less. B. 15% of males have a head circumference that is 41.5 cm or less. OC. 15% of 3- to 5-month-old males have a head circumference that is 41.5 cm or more. OD. 15% of 3- to 5-month-old males have a head circumference that is 41.5 cm or less. Standing Height (cm) Age Percentile 10th 25th 50th 75th 90th 20-29 166.8 171.5 176.7 181.4 186.8 30-39 166.9 171.3 176.0 181.9 186.2 40-49 167.9 172.1 176.9 182.1 186.0 50-59 166.0 170.8 176.0 181.2 185.4 60-69 165.3 170.1 175.1 179.5 183.7 70-79 163.2 167.5 172.9 178.1 181.7 80 or older 161.7 166.1 170.5 175.3 179.4 The following data represent the monthly phone use, in minutes, of a customer enrolled in a fraud prevention program for the past 20 months. The phone company decides to use the upper fence as the cutoff point for the number of minutes at which the customer should be contacted. What is the cutoff point? 460 401 377 519 488 401 482 345 519 380 482 472 372 540 351 351 524 383 549 370 The data represent the age of world leaders on their day of inauguration. Find the five-number summary, and construct a boxplot for the data. Comment on the shape of the distribution. 5464 55 69 44 55 61 50 41 62 6425 48 44 48 58 80 80 80
Step by Step Solution
There are 3 Steps involved in it

Get step-by-step solutions from verified subject matter experts