

Question: Oneblade Inc. has developed a powerful efficient snow remover that is significantly less polluting than existing snow removers currently on the market. The company spent
Oneblade Inc. has developed a powerful efficient snow remover that is significantly less polluting than existing snow removers currently on the market. The company spent $ developing this product and the marketing department spent another $ to assess the market demand. It would cost $ million at Year to buy the equipment necessary to manufacture the efficient snow blower. The project would require net working capital at the beginning of each year equal to of sales NOWC Sales NOWCSales etc. The efficient snow blowers would sell for $ per unit, and Oneblade believes that variable costs would amount to $ per unit. The company expects that the sales price and variable costs would increase at the inflation rate of after year The company's nonvariable costs would be $ in Year and are expected to increase with inflation. The efficient snow blower project would have a life of years. If the project is undertaken, it must be continued for the entire years. Also, the project's returns are expected to be highly correlated with returns on the firm's other assets. The firm believes it could sell units per year.
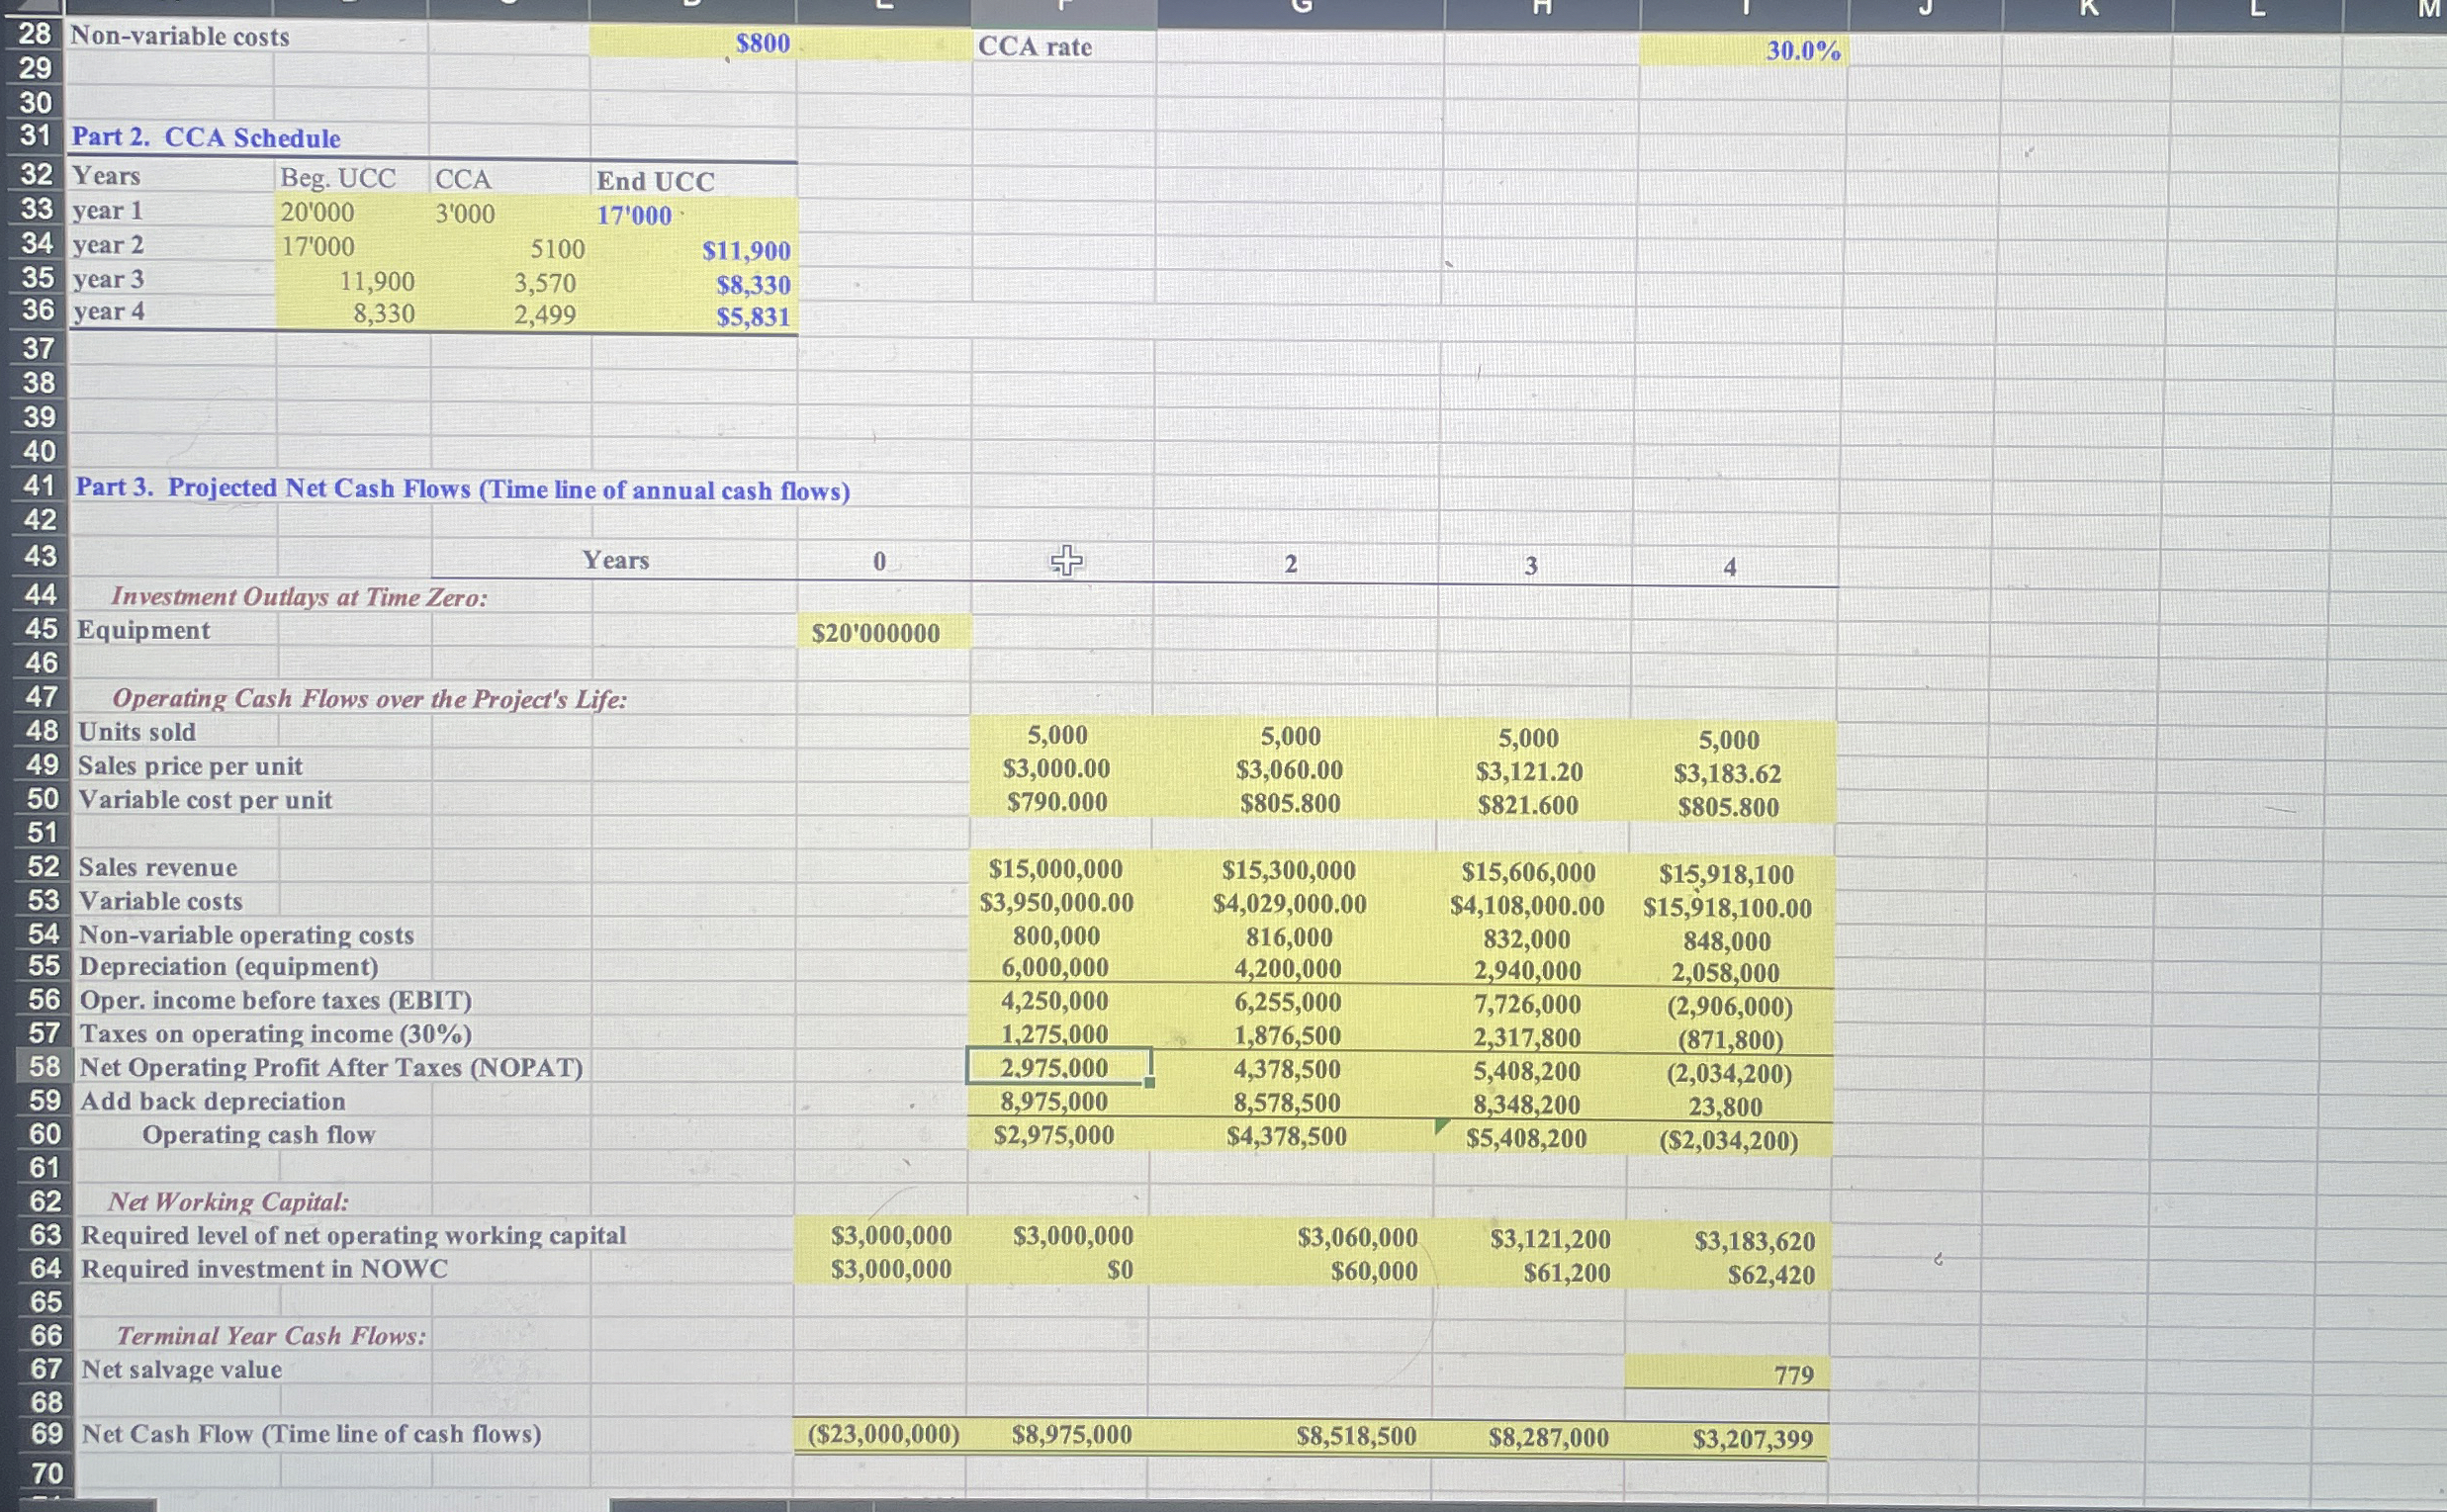
The equipment would be depreciated using a CCA rate of The estimated market value of the equipment at the end of the project's year life is $ Oneblade has other assets in this asset class. Oneblade Inc.s federalplusprovincial tax rate is Its cost of capital is for average risk projects. Lowrisk projects are evaluated with a WACC of and highrisk projects at
a Develop a spreadsheet model and use it to find the project's NPV IRR, and payback.
Part Input Data in thousands of dollars except for unit amount
Equipment cost
Net Operating WCsales
Yearly sales in units
Sales price per unit
Variable cost per unit
Nonvariable costs
tableYearsBeg. UCC,CCA,,year year $year $year $
b Conduct a sensitivity analysis to determine the sensitivity of NPV to changes in thesales price, variable costs per unit, and number of units sold. Set these variables' values at and above and below their base case values. Include a graph in your analysis.
Evaluating Risk: Sensitivity Analysis
I. Sensitivity of NPV to Changes in Inputs. Here we use an Excel "Data Table" to find NPV for different unit sales, variable costs, WACC, and sales prices, holding other thing constant.
table Deviation,st YEAR UNIT SALESfromUnits,NPVBase Case,Sold,$ Please include instructions on how you used excel to calculate the sensitivity analysis beacsue i will have to know how to perform tye sensitivity analysis beac
syee i dont know how
Step by Step Solution
There are 3 Steps involved in it
1 Expert Approved Answer
Step: 1 Unlock

Question Has Been Solved by an Expert!
Get step-by-step solutions from verified subject matter experts
Step: 2 Unlock
Step: 3 Unlock