

Question: only answer question 3 please write out thr r code thank you ! A corporation's earnings in a given year is its income minus its
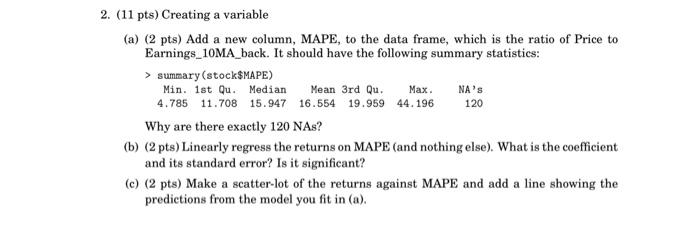
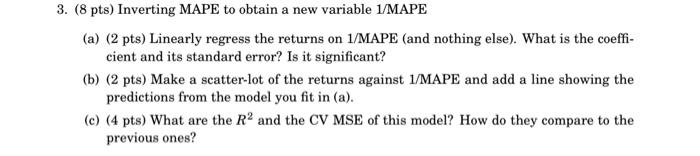
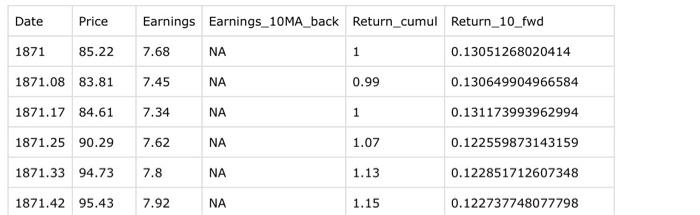
A corporation's earnings in a given year is its income minus its expenses. Our data set for this homework looks at the relationship between US stock prices, the earnings of the corporations, and the returns on investment in stocks, with returns counting both changes in stock price and dividends paid to stock holders. Specifically, our data contains the following variables: - Date, with fractions of a year indicating months - Price of an index of US stocks (inflation-adjusted) - Earnings per share (also inflation-adjusted); - Earnings_10MA_back, a ten-year moving average of earnings, looking backwards from the current date; - Return_cumul, cumulative return of investing in the stock index, from the beginning; - Return_10_fwd, the average rate of return over the next 10 years from the current date. Note: in all following questions, "Returns" will refer to Return_10_fwd. (a) (2 pts) Add a new column, MAPE, to the data frame, which is the ratio of Price to Earnings_10MA_back. It should have the following summary statistics: Why are there exactly 120 NAs? (b) ( 2 pts) Linearly regress the returns on MAPE (and nothing else). What is the coefficient and its standard error? Is it significant? (c) (2 pts) Make a scatter-lot of the returns against MAPE and add a line showing the predictions from the model you fit in (a). 3. (8 pts) Inverting MAPE to obtain a new variable 1/MAPE (a) (2 pts) Linearly regress the returns on 1/MAPE (and nothing else). What is the coefficient and its standard error? Is it significant? (b) (2 pts) Make a scatter-lot of the returns against 1/MAPE and add a line showing the predictions from the model you fit in (a). (c) (4 pts) What are the R2 and the CV MSE of this model? How do they compare to the previous ones? \begin{tabular}{|l|l|l|l|l|l|} \hline Date & Price & Earnings & Earnings_10MA_back & Return_cumul & Return_10_fwd \\ \hline 1871 & 85.22 & 7.68 & NA & 1 & 0.13051268020414 \\ \hline 1871.08 & 83.81 & 7.45 & NA & 0.99 & 0.130649904966584 \\ \hline 1871.17 & 84.61 & 7.34 & NA & 1 & 0.131173993962994 \\ \hline 1871.25 & 90.29 & 7.62 & NA & 1.07 & 0.122559873143159 \\ \hline 1871.33 & 94.73 & 7.8 & NA & 1.13 & 0.122851712607348 \\ \hline 1871.42 & 95.43 & 7.92 & NA & 1.15 & 0.122737748077798 \\ \hline \end{tabular} A corporation's earnings in a given year is its income minus its expenses. Our data set for this homework looks at the relationship between US stock prices, the earnings of the corporations, and the returns on investment in stocks, with returns counting both changes in stock price and dividends paid to stock holders. Specifically, our data contains the following variables: - Date, with fractions of a year indicating months - Price of an index of US stocks (inflation-adjusted) - Earnings per share (also inflation-adjusted); - Earnings_10MA_back, a ten-year moving average of earnings, looking backwards from the current date; - Return_cumul, cumulative return of investing in the stock index, from the beginning; - Return_10_fwd, the average rate of return over the next 10 years from the current date. Note: in all following questions, "Returns" will refer to Return_10_fwd. (a) (2 pts) Add a new column, MAPE, to the data frame, which is the ratio of Price to Earnings_10MA_back. It should have the following summary statistics: Why are there exactly 120 NAs? (b) ( 2 pts) Linearly regress the returns on MAPE (and nothing else). What is the coefficient and its standard error? Is it significant? (c) (2 pts) Make a scatter-lot of the returns against MAPE and add a line showing the predictions from the model you fit in (a). 3. (8 pts) Inverting MAPE to obtain a new variable 1/MAPE (a) (2 pts) Linearly regress the returns on 1/MAPE (and nothing else). What is the coefficient and its standard error? Is it significant? (b) (2 pts) Make a scatter-lot of the returns against 1/MAPE and add a line showing the predictions from the model you fit in (a). (c) (4 pts) What are the R2 and the CV MSE of this model? How do they compare to the previous ones? \begin{tabular}{|l|l|l|l|l|l|} \hline Date & Price & Earnings & Earnings_10MA_back & Return_cumul & Return_10_fwd \\ \hline 1871 & 85.22 & 7.68 & NA & 1 & 0.13051268020414 \\ \hline 1871.08 & 83.81 & 7.45 & NA & 0.99 & 0.130649904966584 \\ \hline 1871.17 & 84.61 & 7.34 & NA & 1 & 0.131173993962994 \\ \hline 1871.25 & 90.29 & 7.62 & NA & 1.07 & 0.122559873143159 \\ \hline 1871.33 & 94.73 & 7.8 & NA & 1.13 & 0.122851712607348 \\ \hline 1871.42 & 95.43 & 7.92 & NA & 1.15 & 0.122737748077798 \\ \hline \end{tabular}
Step by Step Solution
There are 3 Steps involved in it

Get step-by-step solutions from verified subject matter experts