Question: only answer question 5 please show the excel reference Problem #5: Referring to Problem #4 above, create a graph of the total by date from

only answer question 5

please show the excel reference

only answer question 5 please show the excel reference Problem #5: Referring

to Problem #4 above, create a graph of the total by date

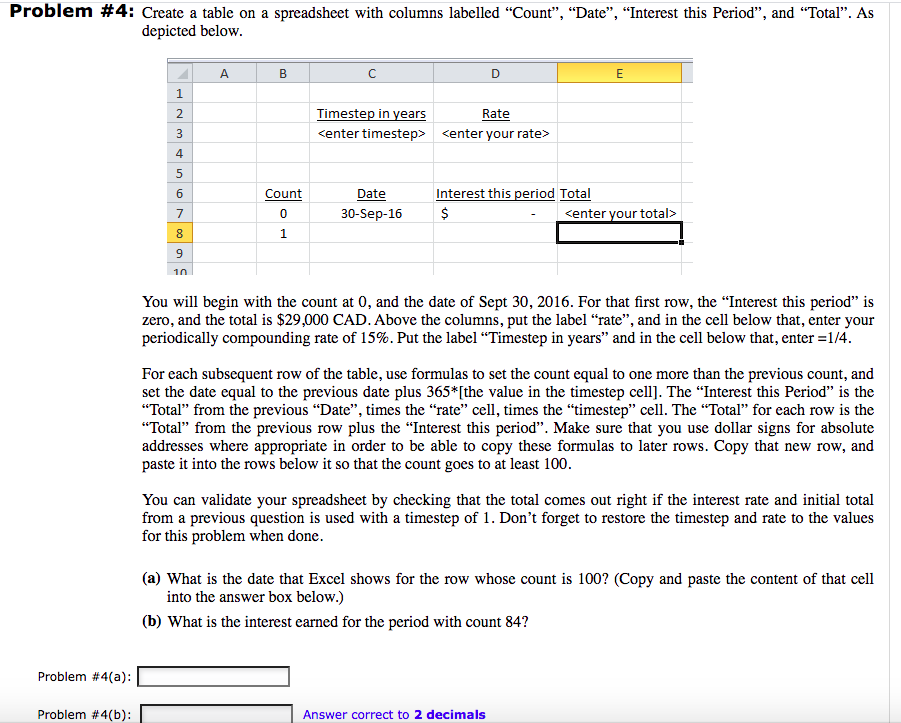
Problem #5: Referring to Problem #4 above, create a graph of the total by date from Sept. 2016 to Sept. 2024 using the Scatterplot type that shows straight line interpolation between points, but which does not put dots on the data points. (Note: to include a non-adjacent column of data in a selection, use the key to continue with the selection.) Take a screen shot of your picture, paste it into an application (like Paint), and save it as a (.png) file. Then upload your picture below. Problem #5: | Upload Now Save Problem #4: Create a table on a spreadsheet with columns labelled "Count, Date, Interest this period, and Total. As depicted below. B D E 1 2 Timestep in years Rate 4 5 6 Count Date 30-Sep-16 Interest this period Total $

Step by Step Solution

There are 3 Steps involved in it

1 Expert Approved Answer
Step: 1 Unlock blur-text-image
Question Has Been Solved by an Expert!

Get step-by-step solutions from verified subject matter experts

Step: 2 Unlock
Step: 3 Unlock

Students Have Also Explored These Related Finance Questions!