

Question: ONLY ANSWERS TYPED IN THE SOLUTION BOX WILL BE MARKED. Do NOT attach any solutions - these will NOT be marked The following data represents
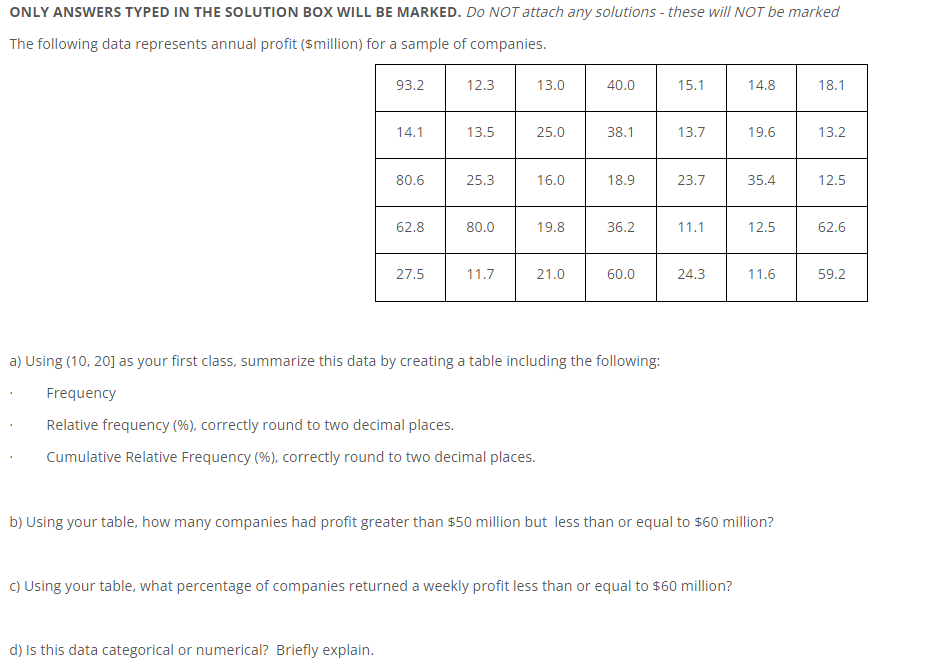
ONLY ANSWERS TYPED IN THE SOLUTION BOX WILL BE MARKED. Do NOT attach any solutions - these will NOT be marked The following data represents annual profit ($million) for a sample of companies. 93.2 12.3 13.0 40.0 15.1 14.8 18.1 14.1 13.5 25.0 38.1 13.7 19.6 13.2 80.6 25.3 16.0 18.9 23.7 35.4 12.5 62.8 80.0 19.8 36.2 11.1 12.5 62.6 27.5 11.7 21.0 60.0 24.3 11.6 59.2 a) Using (10, 20] as your first class, summarize this data by creating a table including the following: Frequency Relative frequency (%), correctly round to two decimal places. Cumulative Relative Frequency (%), correctly round to two decimal places. b) Using your table, how many companies had profit greater than $50 million but less than or equal to $60 million? () Using your table, what percentage of companies returned a weekly profit less than or equal to $60 million? d) Is this data categorical or numerical? Briefly explain
Step by Step Solution
There are 3 Steps involved in it

Get step-by-step solutions from verified subject matter experts