

Question: only do coding using Jupyter (python programming) ignore the writing Writing and Coding) Suppose X, are i.i.d. random variable uniformly distributed in [0, 1]. Let
only do coding using Jupyter (python programming)
ignore the writing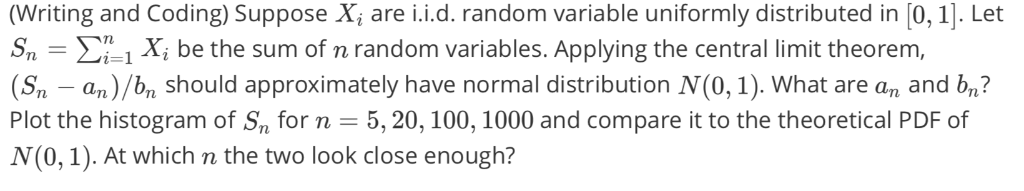
Writing and Coding) Suppose X, are i.i.d. random variable uniformly distributed in [0, 1]. Let Sn X, be the sum of n random variables. Applying the central limit theorem, Sn an)/bn should approximately have normal distribution N(0, 1). What are an and bn? Plot the histogram of S forn 5,20, 100, 1000 and compare it to the theoretical PDF of N(0,1). At which n the two look close enough? Writing and Coding) Suppose X, are i.i.d. random variable uniformly distributed in [0, 1]. Let Sn X, be the sum of n random variables. Applying the central limit theorem, Sn an)/bn should approximately have normal distribution N(0, 1). What are an and bn? Plot the histogram of S forn 5,20, 100, 1000 and compare it to the theoretical PDF of N(0,1). At which n the two look close enough
Step by Step Solution
There are 3 Steps involved in it

Get step-by-step solutions from verified subject matter experts