

Question: Only do question 2 Extra Credit Exercise 1: Extra Credit Exercise: Download the Matlab data file fibonacci.mat from Canvas and use the load function to
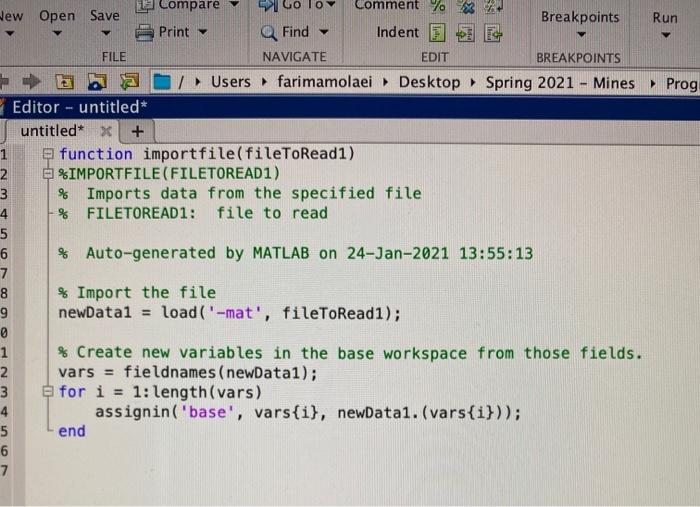
Extra Credit Exercise 1: Extra Credit Exercise: Download the Matlab data file fibonacci.mat from Canvas and use the load function to load the data it into your Matlab workspace. This file contains the first 1000 terms of the Fibonacci sequence. Find the first term of the Fibbonacci sequence where the value of that term is greater than 1E100. Display the term and the number to the user, and verify that you found the correct number. Extra Credit Exercise 2: The amount, A, which will be in a bank account that earns compound interest, is calculated with the following formula: mt A = P(1+3) where P is the principle (the amount originally deposited in the account), r is the annual interest rate (as a decimal, i.e. 3%=03), n is the number of times the interest is compounded (how often interest earnings are paid into the account), and t is the number of years that the account earns interest. Simple interest will accumulate lower interest earnings over time because the interest is not compounded one or more times per year (i.e. you're not earning interest on accumulated prior interest). The equation for simple interest is: A = P(1+rt) Write a script which prompts the user for a principle dollar amount and the interest rater (i.e. 0.03 for 3%). The script should calculate the amount that will be in the savings account from 1 to 30 years in increments of 1 year assuming that the interest is compounded monthly, or n=12 (compounded 12 times per year, or monthly). Note that since t will be a vector of years from 1 to 30, you'll need to use the element-wise operator in the equation above to calculate the amount saved A for each yeart (element-wise 1D array operation). Plot the amount saved A versus the year t using a solid red line. Next, add a dotted blue curve to the same plot using the simple interest equation for comparison, Calculate and print out how much your savings has multiplied relatively to the principle after 30 years in each case for comparison. Run La Compare New Open Save Comment Breakpoints Print Q Find Indent FILE NAVIGATE EDIT BREAKPOINTS /Users farimamolaei Desktop Spring 2021 - Mines Prog Editor - untitled untitled* X + 1 function importfile(fileToRead1) 2 %IMPORTFILE(FILETOREAD1) 3 % Imports data from the specified file 4 % FILETOREAD1: file to read 5 6 % Auto-generated by MATLAB on 24-Jan-2021 13:55:13 7 8 % Import the file 9 newDatal = load('-mat', fileToRead1); @ 1 % Create new variables in the base workspace from those fields. 2 vars = fieldnames (newDatai); 3 for i = 1: length(vars) 4 assignin('base', vars{i}, newDatai. (vars{i})); 5 end 6 7
Step by Step Solution
There are 3 Steps involved in it

Get step-by-step solutions from verified subject matter experts