

Question: only have 1 post left please answer both! Thanks in advance!! A textile manufacturer wants to set up a control chart for irregularities (e.g., oil
only have 1 post left please answer both! Thanks in advance!! 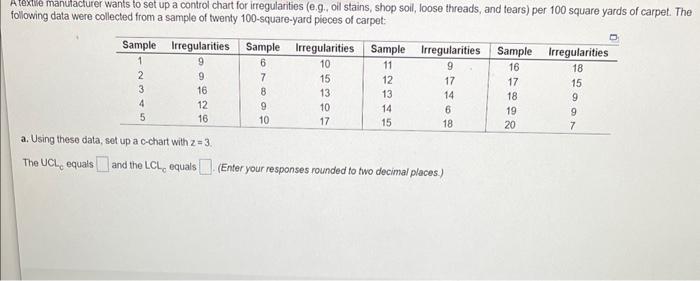
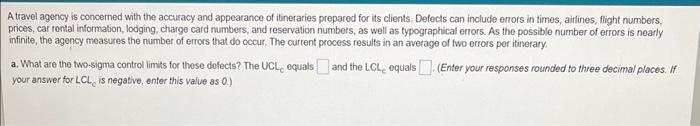
A textile manufacturer wants to set up a control chart for irregularities (e.g., oil stains, shop soil, loose threads, and tears) per 100 square yards of carpet. The following data were collected from a sample of twenty 100-square-yard pieces of carpet: Sample 1 2 3 4 5 Irregularities 9 9 16 12 16 a. Using these data, set up a c-chart with z=3. The UCL equals Sample Irregularities Sample 6 10 11 7 8 9 10 15 13: 10 17 12 13 14 15 Irregularities 9 17 14 6 18 and the LCL, equals(Enter your responses rounded to two decimal places.) Sample Irregularities 16 18 17 18 19 20 15 9 9 7 A travel agency is concerned with the accuracy and appearance of itineraries prepared for its clients. Defects can include errors in times, airlines, flight numbers, prices, car rental information, lodging, charge card numbers, and reservation numbers, as well as typographical errors. As the possible number of errors is nearly infinite, the agency measures the number of errors that do occur. The current process results in an average of two errors per itinerary. a. What are the two-sigma control limits for these defects? The UCL, equals and the LCL, equals(Enter your responses rounded to three decimal places. If your answer for LCL is negative, enter this value as 0.)
Step by Step Solution
There are 3 Steps involved in it
1 Expert Approved Answer
Step: 1 Unlock

Question Has Been Solved by an Expert!
Get step-by-step solutions from verified subject matter experts
Step: 2 Unlock
Step: 3 Unlock