

Question: Only highlighted portion is needed. should be a one line numpy code of the function up top. Assignment 8 The Kozeny-Carmen (K-C) relationship is a

Only highlighted portion is needed. should be a one line numpy code of the function up top.
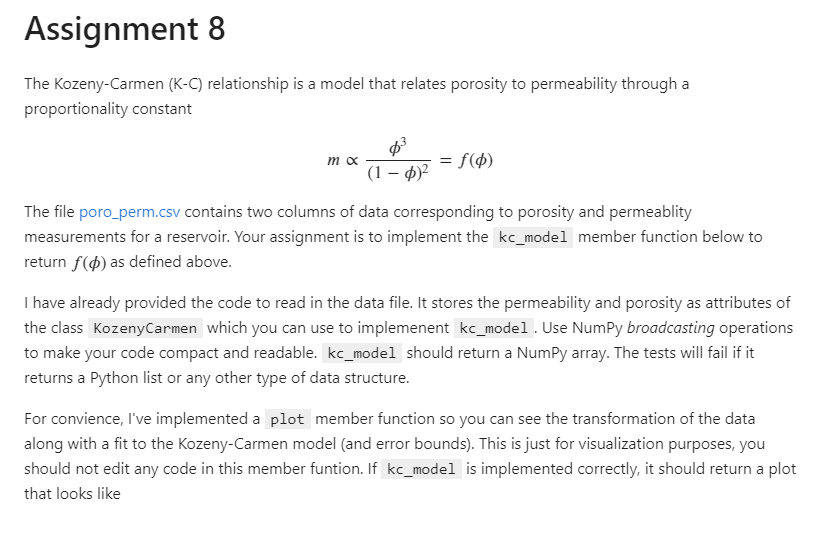
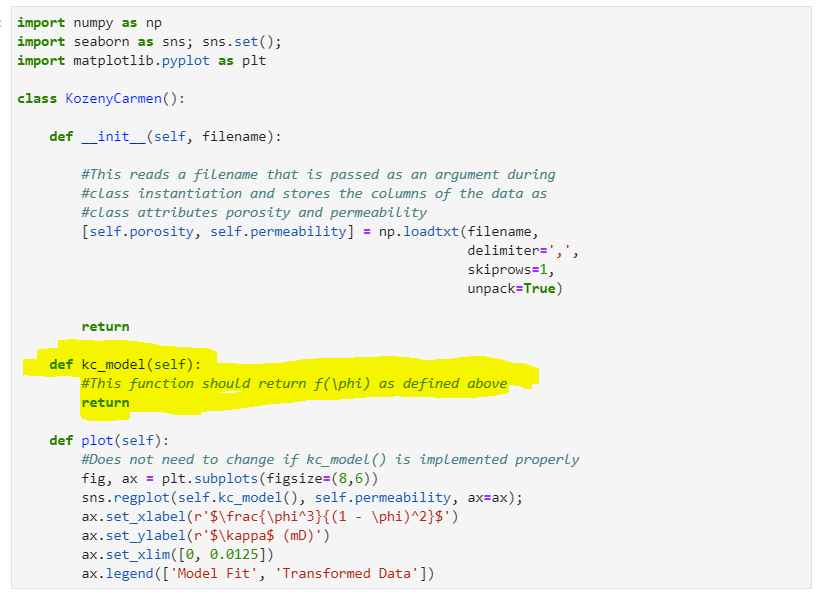
Assignment 8 The Kozeny-Carmen (K-C) relationship is a model that relates porosity to permeability through a proportionality constant ma f(0) (1 - 0)2 The file poro_perm.csv contains two columns of data corresponding to porosity and permeablity measurements for a reservoir. Your assignment is to implement the kc_model member function below to return f() as defined above. I have already provided the code to read in the data file. It stores the permeability and porosity as attributes of the class KozenyCarmen which you can use to implemenent kc_model. Use NumPy broadcasting operations to make your code compact and readable. kc_model should return a Numpy array. The tests will fail if it returns a Python list or any other type of data structure. For convience, I've implemented a plot member function so you can see the transformation of the data along with a fit to the Kozeny-Carmen model (and error bounds). This is just for visualization purposes, you should not edit any code in this member funtion. If kc_model is implemented correctly, it should return a plot that looks like Model Fit Transformed Data 300 250 200 K (MD) 150 100 50 0.000 0.002 0.004 0.006 0.008 0.010 0.012 (1 - OP If you'd like to produce this plot in the notebook, simply run KozenyCarmen ('poro_perm.csv').plot() in a code cell. E import numpy as np import seaborn as sns; sns.set(); import matplotlib.pyplot as plt class kozenyCarmen(): def __init__(self, filename): #This reads a filename that is passed as an argument during #class instantiation and stores the columns of the data as #class attributes porosity and permeability [self.porosity, self.permeability] = np.loadtxt(filename, delimiters',', skiprows=1, unpack=True) return def kc_model(self): #This function should return f(\phi) as defined above return def plot(self): #Does not need to change if kc_model() is implemented properly fig, ax = plt. subplots(figsize=(8,6)) sns.regplot(self.kc_model(), self.permeability, ax=ax); ax.set_xlabel(r'$\frac{\phi^3}{(1 - \phi)^2}$') ax.set_ylabel(r'$\kappa$ (mD)') ax.set_xlim([0, 0.0125]) ax.legend ([ 'Model Fit', 'Transformed Data']) Assignment 8 The Kozeny-Carmen (K-C) relationship is a model that relates porosity to permeability through a proportionality constant ma f(0) (1 - 0)2 The file poro_perm.csv contains two columns of data corresponding to porosity and permeablity measurements for a reservoir. Your assignment is to implement the kc_model member function below to return f() as defined above. I have already provided the code to read in the data file. It stores the permeability and porosity as attributes of the class KozenyCarmen which you can use to implemenent kc_model. Use NumPy broadcasting operations to make your code compact and readable. kc_model should return a Numpy array. The tests will fail if it returns a Python list or any other type of data structure. For convience, I've implemented a plot member function so you can see the transformation of the data along with a fit to the Kozeny-Carmen model (and error bounds). This is just for visualization purposes, you should not edit any code in this member funtion. If kc_model is implemented correctly, it should return a plot that looks like Model Fit Transformed Data 300 250 200 K (MD) 150 100 50 0.000 0.002 0.004 0.006 0.008 0.010 0.012 (1 - OP If you'd like to produce this plot in the notebook, simply run KozenyCarmen ('poro_perm.csv').plot() in a code cell. E import numpy as np import seaborn as sns; sns.set(); import matplotlib.pyplot as plt class kozenyCarmen(): def __init__(self, filename): #This reads a filename that is passed as an argument during #class instantiation and stores the columns of the data as #class attributes porosity and permeability [self.porosity, self.permeability] = np.loadtxt(filename, delimiters',', skiprows=1, unpack=True) return def kc_model(self): #This function should return f(\phi) as defined above return def plot(self): #Does not need to change if kc_model() is implemented properly fig, ax = plt. subplots(figsize=(8,6)) sns.regplot(self.kc_model(), self.permeability, ax=ax); ax.set_xlabel(r'$\frac{\phi^3}{(1 - \phi)^2}$') ax.set_ylabel(r'$\kappa$ (mD)') ax.set_xlim([0, 0.0125]) ax.legend ([ 'Model Fit', 'Transformed Data'])
Step by Step Solution
There are 3 Steps involved in it

Get step-by-step solutions from verified subject matter experts