

Question: Only in excel. Only hard coded formulas. A. If the company manufactures 1,000,000 units per year, which machine should it buy? B. Plot a graph
Only in excel. Only hard coded formulas.
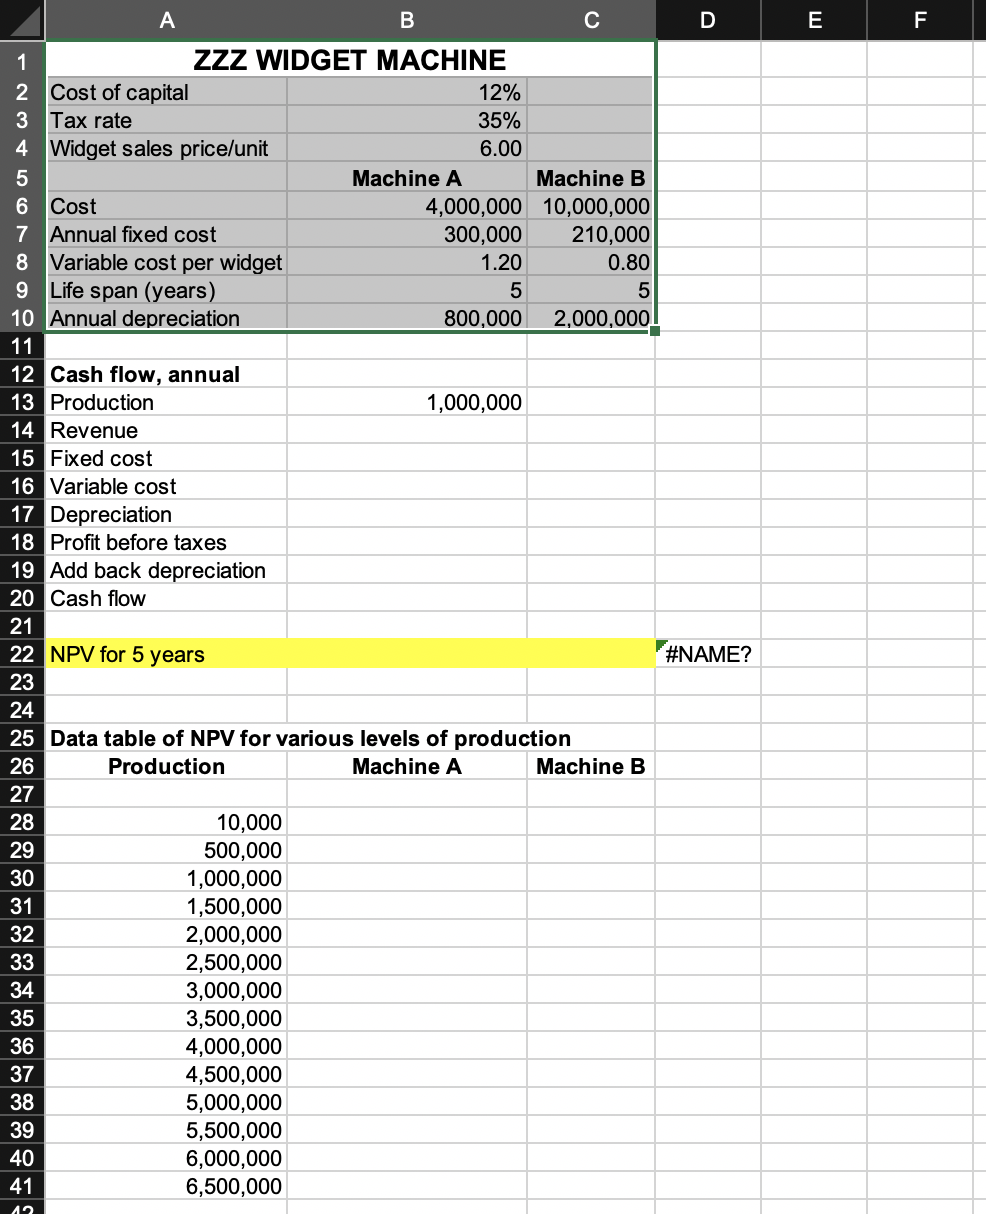
A. If the company manufactures 1,000,000 units per year, which machine should it buy?
B. Plot a graph showing the profitability of investment in each machine type depending on the annual production.
F OVO AWN- ZZZ WIDGET MACHINE Cost of capital 12% Tax rate 35% Widget sales price/unit 6.00 Machine A Machine B Cost 4,000,000 10,000,000 Annual fixed cost 300,000 210,000 Variable cost per widget 1.20 0.80 Life span (years) 5 5 10 Annual depreciation 800,000 2,000,000! 1,000,000 12 Cash flow, annual 13 Production 14 Revenue 15 Fixed cost 16 Variable cost 17 Depreciation 18 Profit before taxes 19 Add back depreciation 20 Cash flow 21 22 NPV for 5 years #NAME? 23 31 24 25 Data table of NPV for various levels of production 26 Production Machine A Machine B 27 28 10,000 29 500,000 30 1,000,000 1,500,000 32 2,000,000 33 2,500,000 3,000,000 35 3,500,000 4,000,000 4,500,000 38 5,000,000 5,500,000 6,000,000 6,500,000 34 36 37 39 40 41 12 F OVO AWN- ZZZ WIDGET MACHINE Cost of capital 12% Tax rate 35% Widget sales price/unit 6.00 Machine A Machine B Cost 4,000,000 10,000,000 Annual fixed cost 300,000 210,000 Variable cost per widget 1.20 0.80 Life span (years) 5 5 10 Annual depreciation 800,000 2,000,000! 1,000,000 12 Cash flow, annual 13 Production 14 Revenue 15 Fixed cost 16 Variable cost 17 Depreciation 18 Profit before taxes 19 Add back depreciation 20 Cash flow 21 22 NPV for 5 years #NAME? 23 31 24 25 Data table of NPV for various levels of production 26 Production Machine A Machine B 27 28 10,000 29 500,000 30 1,000,000 1,500,000 32 2,000,000 33 2,500,000 3,000,000 35 3,500,000 4,000,000 4,500,000 38 5,000,000 5,500,000 6,000,000 6,500,000 34 36 37 39 40 41 12
Step by Step Solution
There are 3 Steps involved in it

Get step-by-step solutions from verified subject matter experts