

Question: Only interpretation of the box plot figures there is no data. The question is only on how to interpret box plot looking like this, below
Only interpretation of the box plot figures there is no data.
The question is only on how to interpret box plot looking like this, below figure
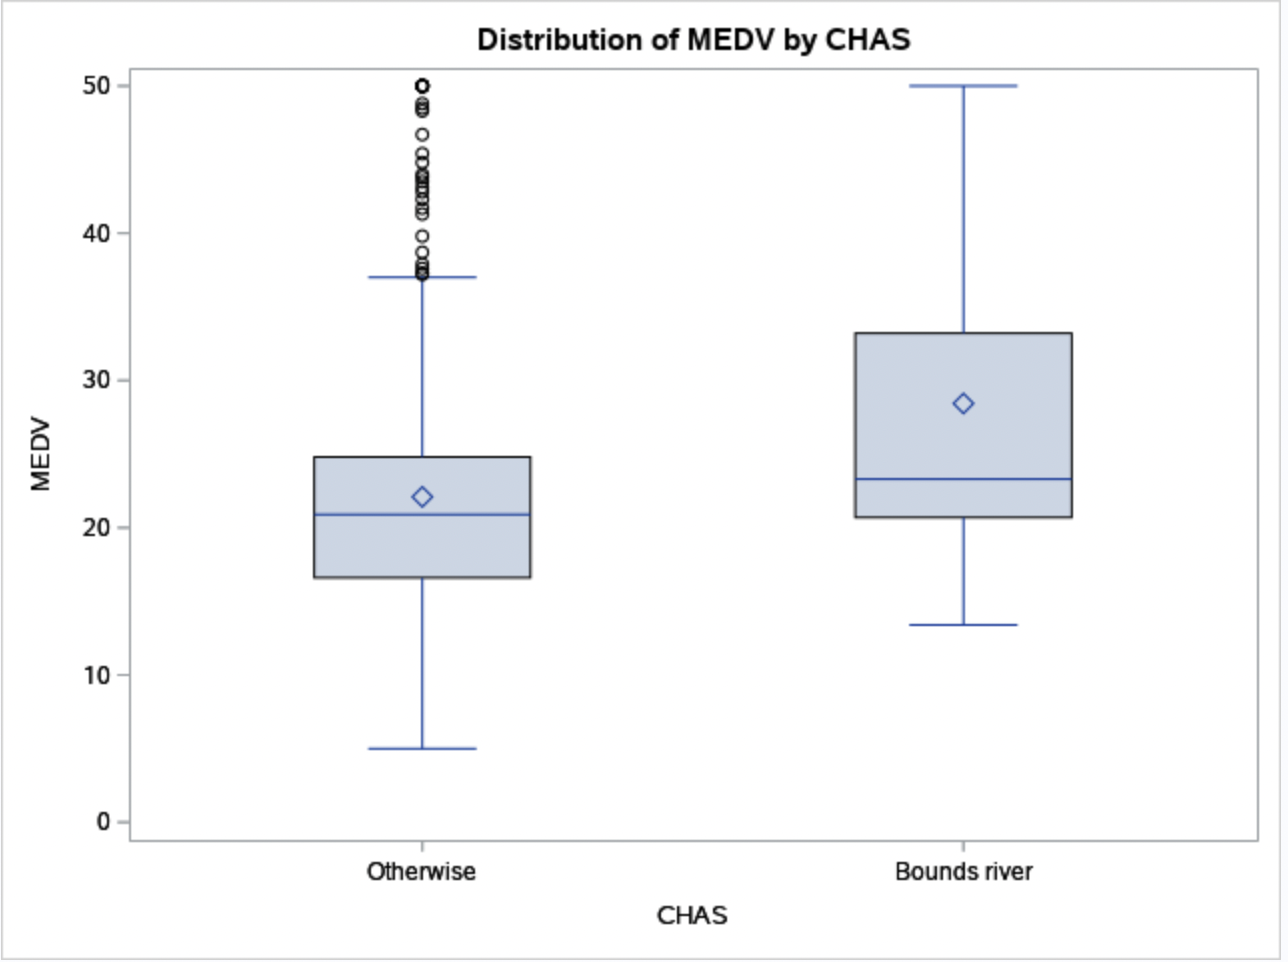
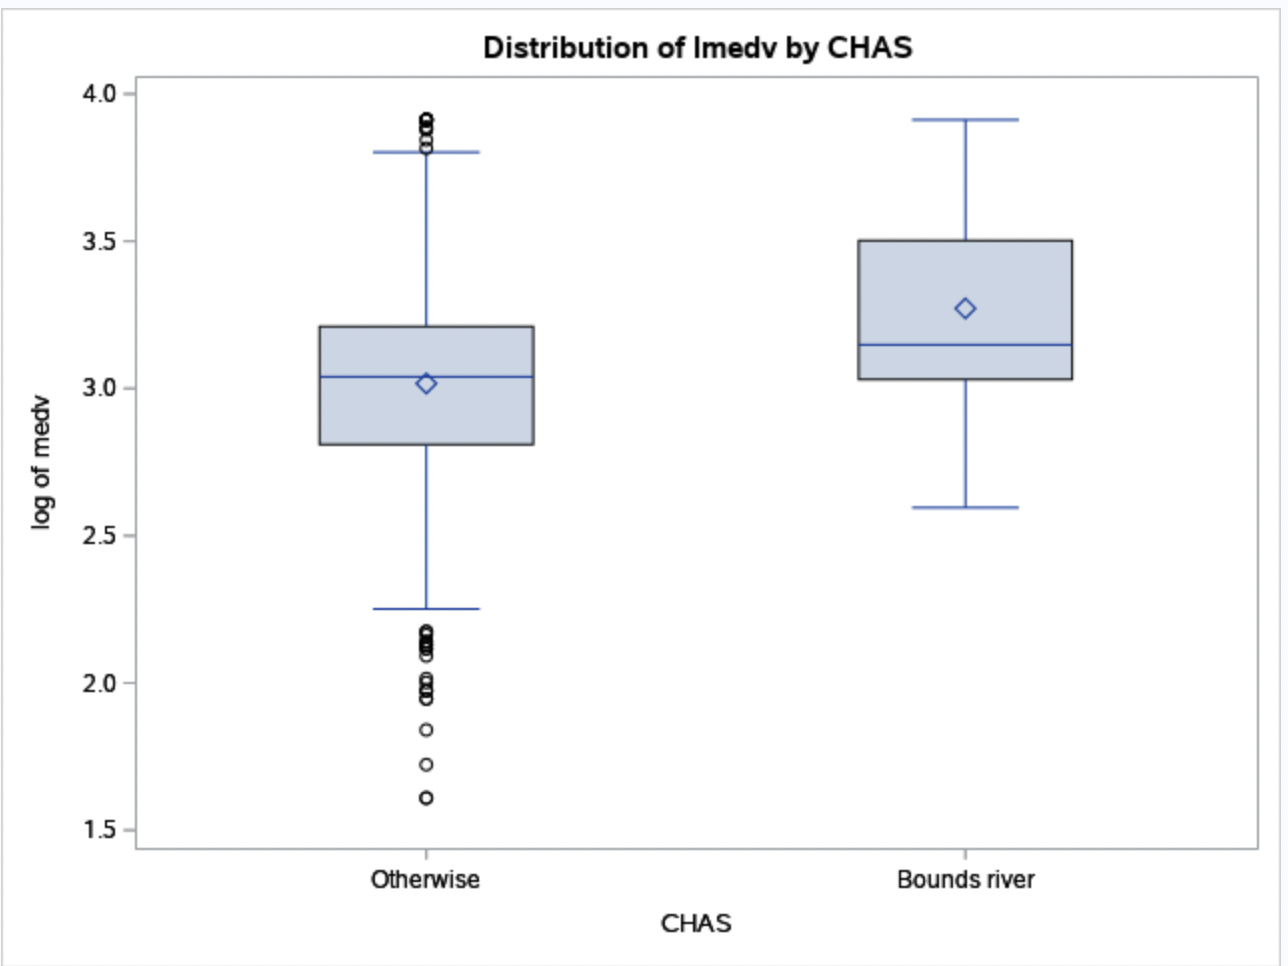
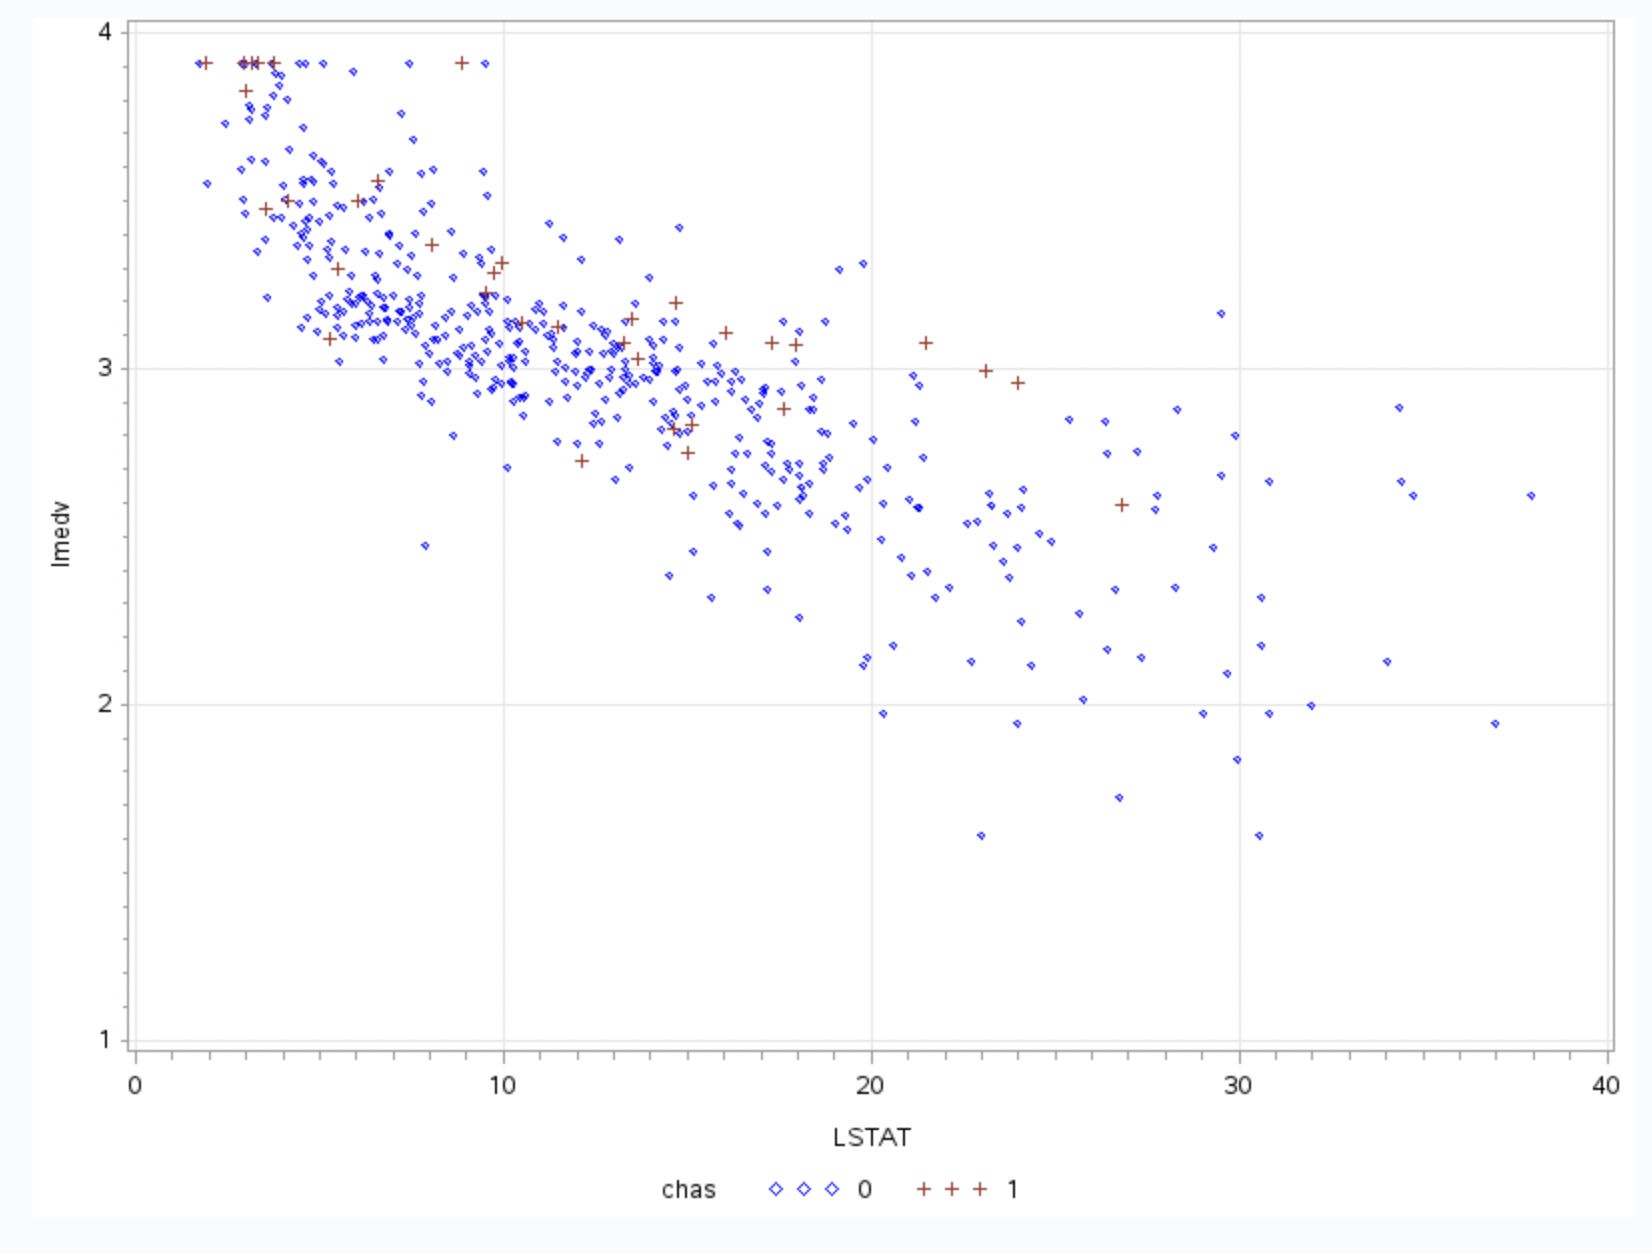
Compare the distribution of both mdev and lmdev( log of medv) for different chas levels.
What is your conclusion based on the plot?
Step by Step Solution
There are 3 Steps involved in it
1 Expert Approved Answer
Step: 1 Unlock

Question Has Been Solved by an Expert!
Get step-by-step solutions from verified subject matter experts
Step: 2 Unlock
Step: 3 Unlock