

Question: Only need an explanation for Exercise 9.3 (a) and 9.4 (a) / Miscellaneous Topics Exercise 9.3: % Cao Hour Twenty-four hourly readings of the percent
Only need an explanation for Exercise 9.3 (a) and 9.4 (a)
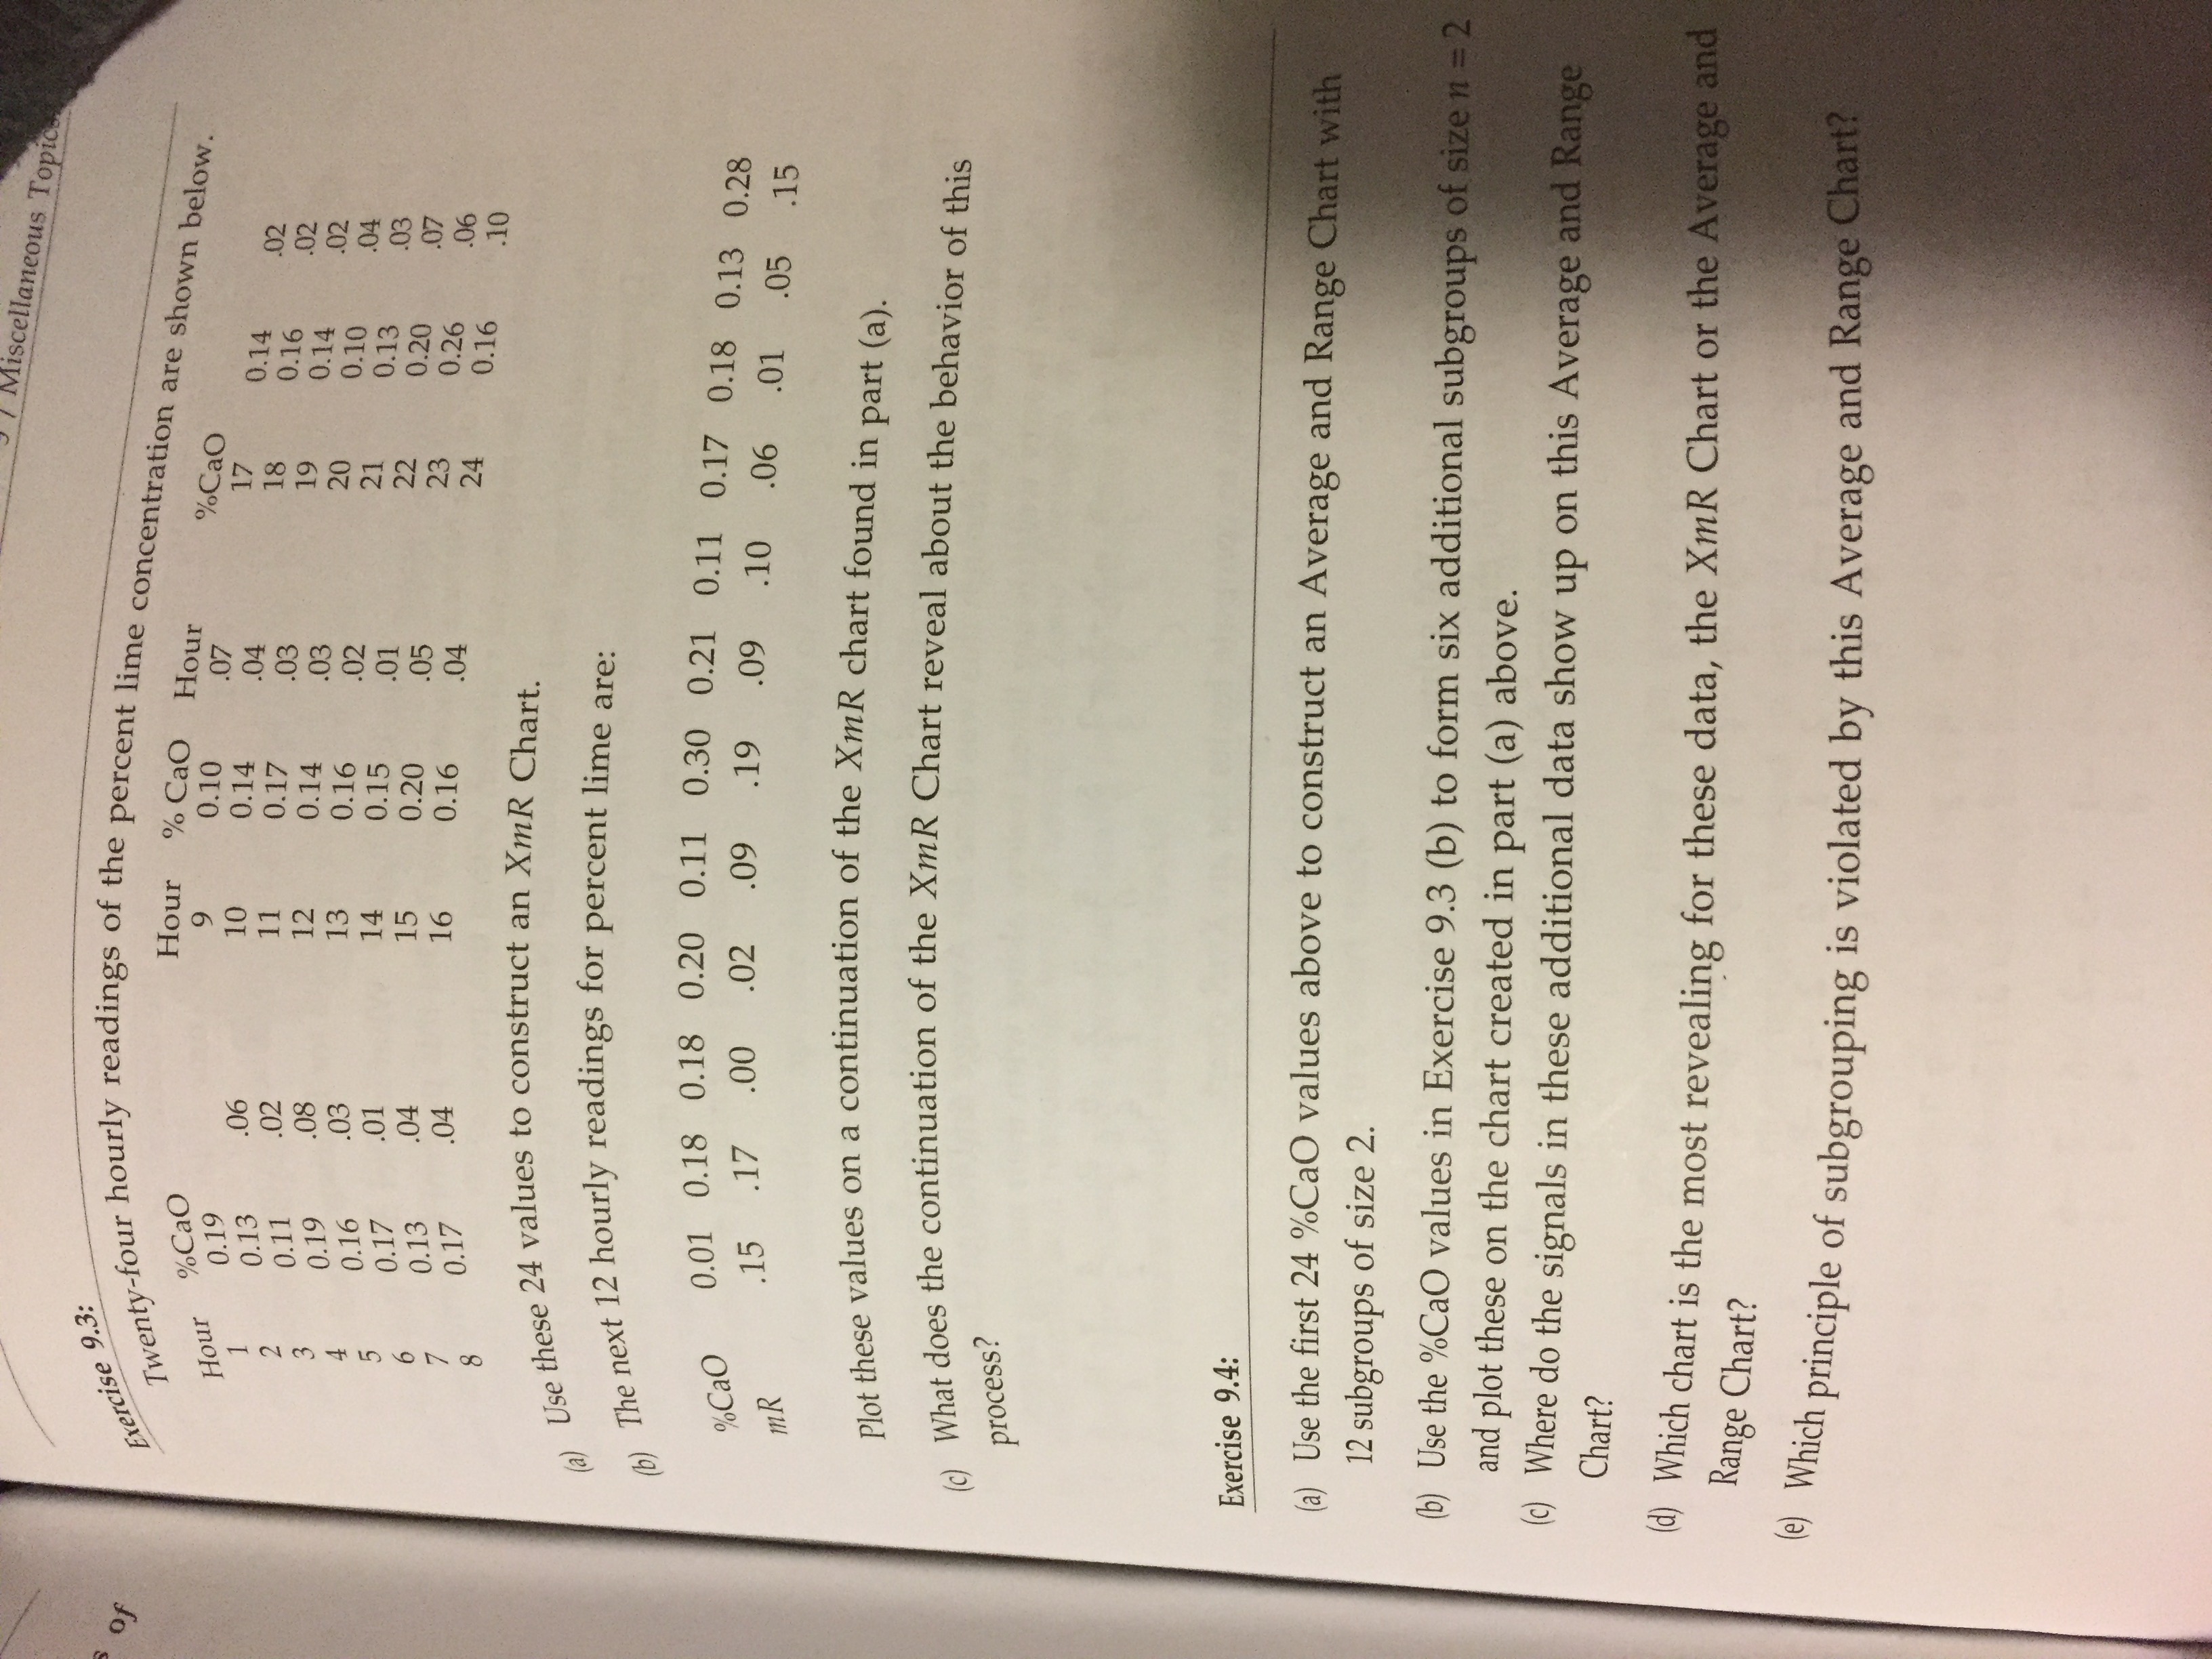
/ Miscellaneous Topics Exercise 9.3: % Cao Hour Twenty-four hourly readings of the percent lime concentration are shown below. % CaO Hour Hour 9 0.10 07 %CaO 0.19 06 10 0.14 .04 17 0.13 0.14 11 0.11 .02 0.17 .03 18 0.16 .02 12 0.14 19 0.14 .02 0.19 .08 .03 .03 13 0.16 .02 20 0.10 . 02 0.16 14 .04 0.15 0.13 0.17 01 .01 21 .03 04 15 0.20 0.13 .05 22 0.20 16 0.16 23 .07 0.26 0.17 04 .04 24 .06 0.16 .10 (a) Use these 24 values to construct an XmR Chart. (b) The next 12 hourly readings for percent lime are: % CaO 0.01 0.18 0.18 0.20 0.11 0.30 0.21 0.11 0.17 0.18 0.13 0.28 .15 .17 .00 .02 .09 .19 .09 .10 06 .01 .05 .15 MR Plot these values on a continuation of the Xml chart found in part (a). () What does the continuation of the XmR Chart reveal about the behavior of this process? Exercise 9.4: (a) Use the first 24 %CaO values above to construct an Average and Range Chart with 12 subgroups of size 2. (b) Use the %CaO values in Exercise 9.3 (b) to form six additional subgroups of size n = 2 and plot these on the chart created in part (a) above. (c) Where do the signals in these additional data show up on this Average and Range Chart? (d) Which chart is the most revealing for these data, the XmR Chart or the Average and Range Chart? (e) Which principle of subgrouping is violated by this Average and Range Chart
Step by Step Solution
There are 3 Steps involved in it

Get step-by-step solutions from verified subject matter experts