

Question: only need answer to number 3 quarterly forecasts using regression analysis Lexon Inc. is a large manufacturer of affordable DVD players. Management recently became aware
only need answer to number 3 quarterly forecasts using regression analysis
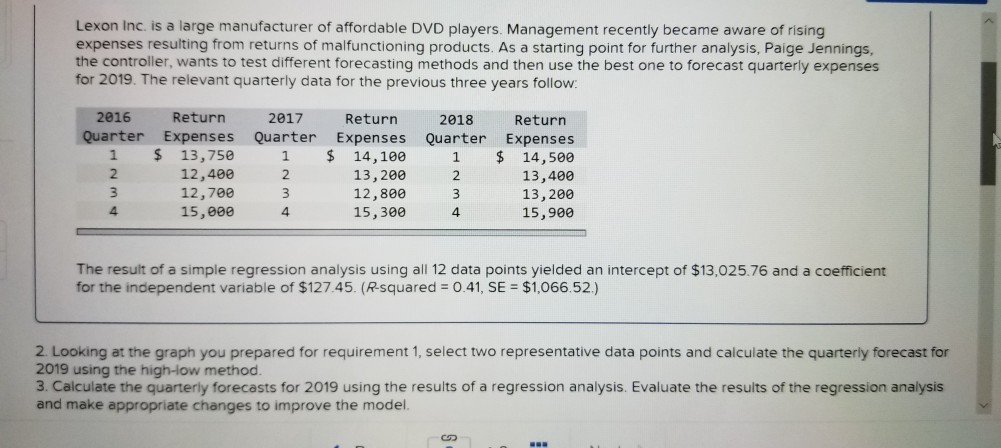
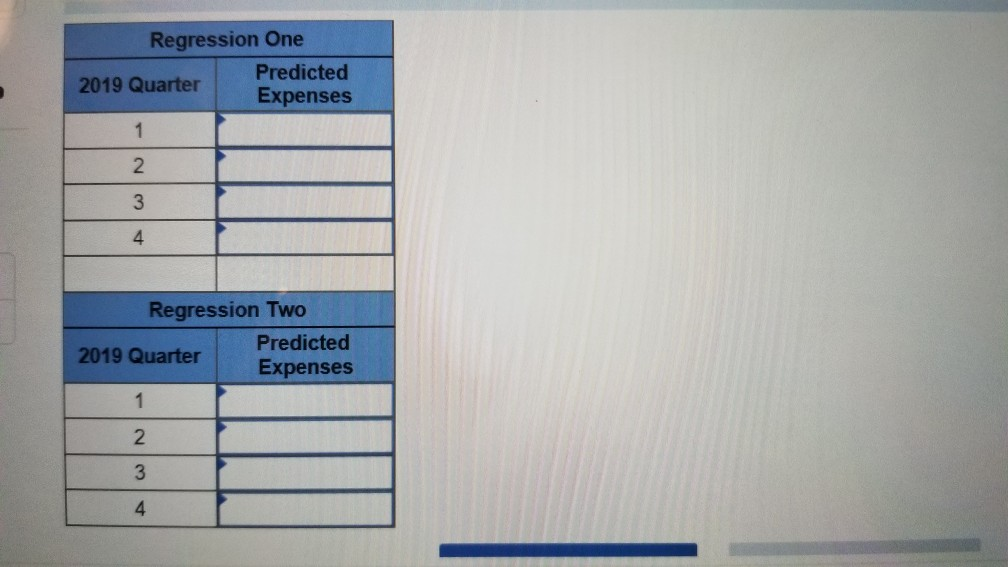
Lexon Inc. is a large manufacturer of affordable DVD players. Management recently became aware of rising expenses resulting from returns of malfunctioning products. As a starting point for further analysis, Paige Jennings, the controller, wants to test different forecasting methods and then use the best one to forecast quarterly expenses for 2019. The relevant quarterly data for the previous three years follow 2017 Return 2018 Return Quarter Expenses Quarter Expenses Quarter Expenses 14,100 1 $ 14,500 13,400 13,200 15,900 2016 Return 1 $ 13,750 2 12,400 2 12,700 3 15,800 13,200 2 12,800 3 15, 300 4 4 4 The result of a simple regression analysis using all 12 data points yielded an intercept of $13,025.76 and a coefficient for the independent variable of $127.45. (R-squared 0.41, SE $1,066.52.) 2. Looking at the graph you prepared for requirement 1, select two representative data points and calculate the quarterly forecast for 2019 using the high-low method 3. Calculate the quarterly forecasts for 2019 using the results of a regression analysis. Evaluate the results of the regression analysis and make appropriate changes to improve the model. Regression One Predicted Expenses 2019 Quarter Regression Two Predicted Expenses 2019 Quarter Lexon Inc. is a large manufacturer of affordable DVD players. Management recently became aware of rising expenses resulting from returns of malfunctioning products. As a starting point for further analysis, Paige Jennings, the controller, wants to test different forecasting methods and then use the best one to forecast quarterly expenses for 2019. The relevant quarterly data for the previous three years follow 2017 Return 2018 Return Quarter Expenses Quarter Expenses Quarter Expenses 14,100 1 $ 14,500 13,400 13,200 15,900 2016 Return 1 $ 13,750 2 12,400 2 12,700 3 15,800 13,200 2 12,800 3 15, 300 4 4 4 The result of a simple regression analysis using all 12 data points yielded an intercept of $13,025.76 and a coefficient for the independent variable of $127.45. (R-squared 0.41, SE $1,066.52.) 2. Looking at the graph you prepared for requirement 1, select two representative data points and calculate the quarterly forecast for 2019 using the high-low method 3. Calculate the quarterly forecasts for 2019 using the results of a regression analysis. Evaluate the results of the regression analysis and make appropriate changes to improve the model. Regression One Predicted Expenses 2019 Quarter Regression Two Predicted Expenses 2019 Quarter
Step by Step Solution
There are 3 Steps involved in it

Get step-by-step solutions from verified subject matter experts