

Question: Only need help on filling out the excel formats. Case 1 - Extreme Mountain Bikes Cost Benefit Analysis Introduction During his junior year in college,
Only need help on filling out the excel formats.
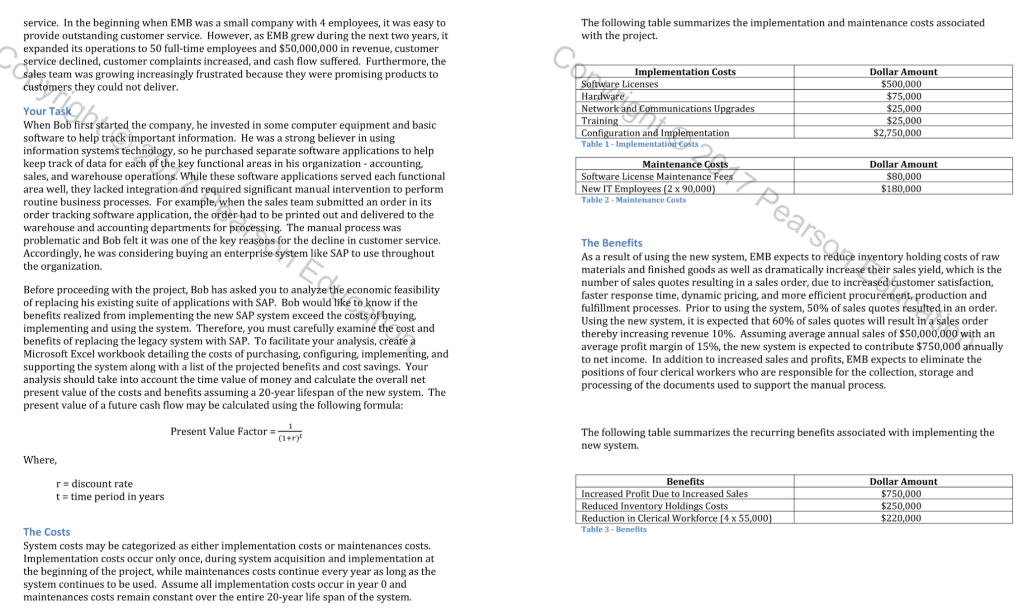
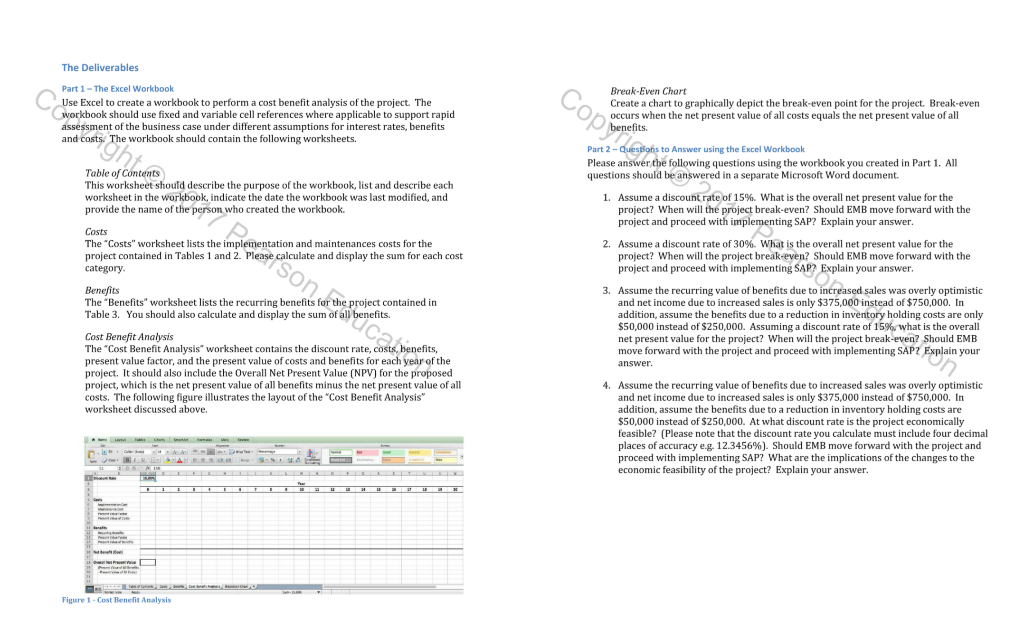
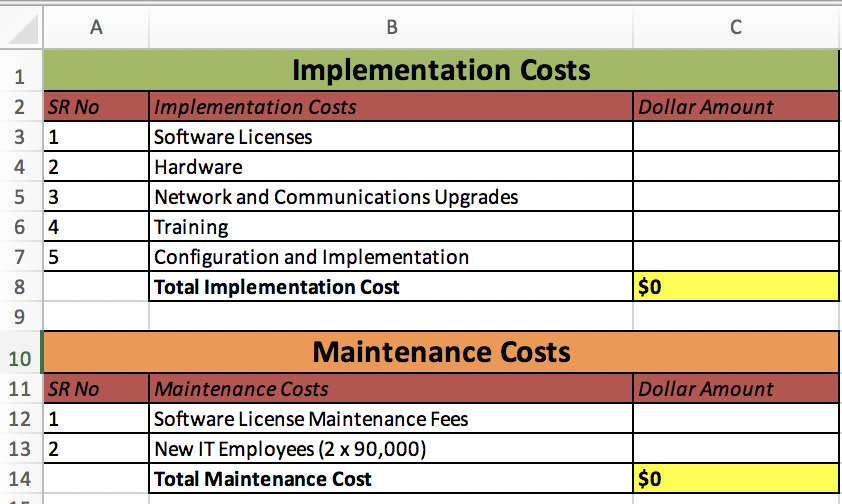
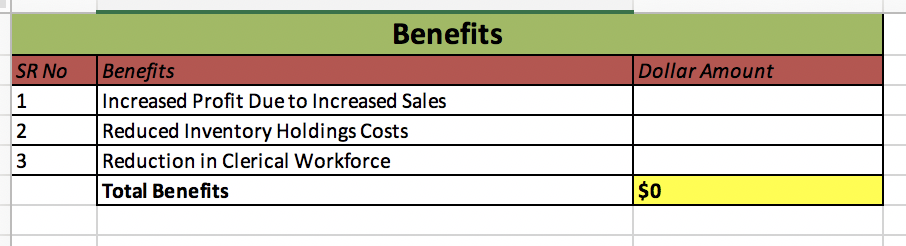
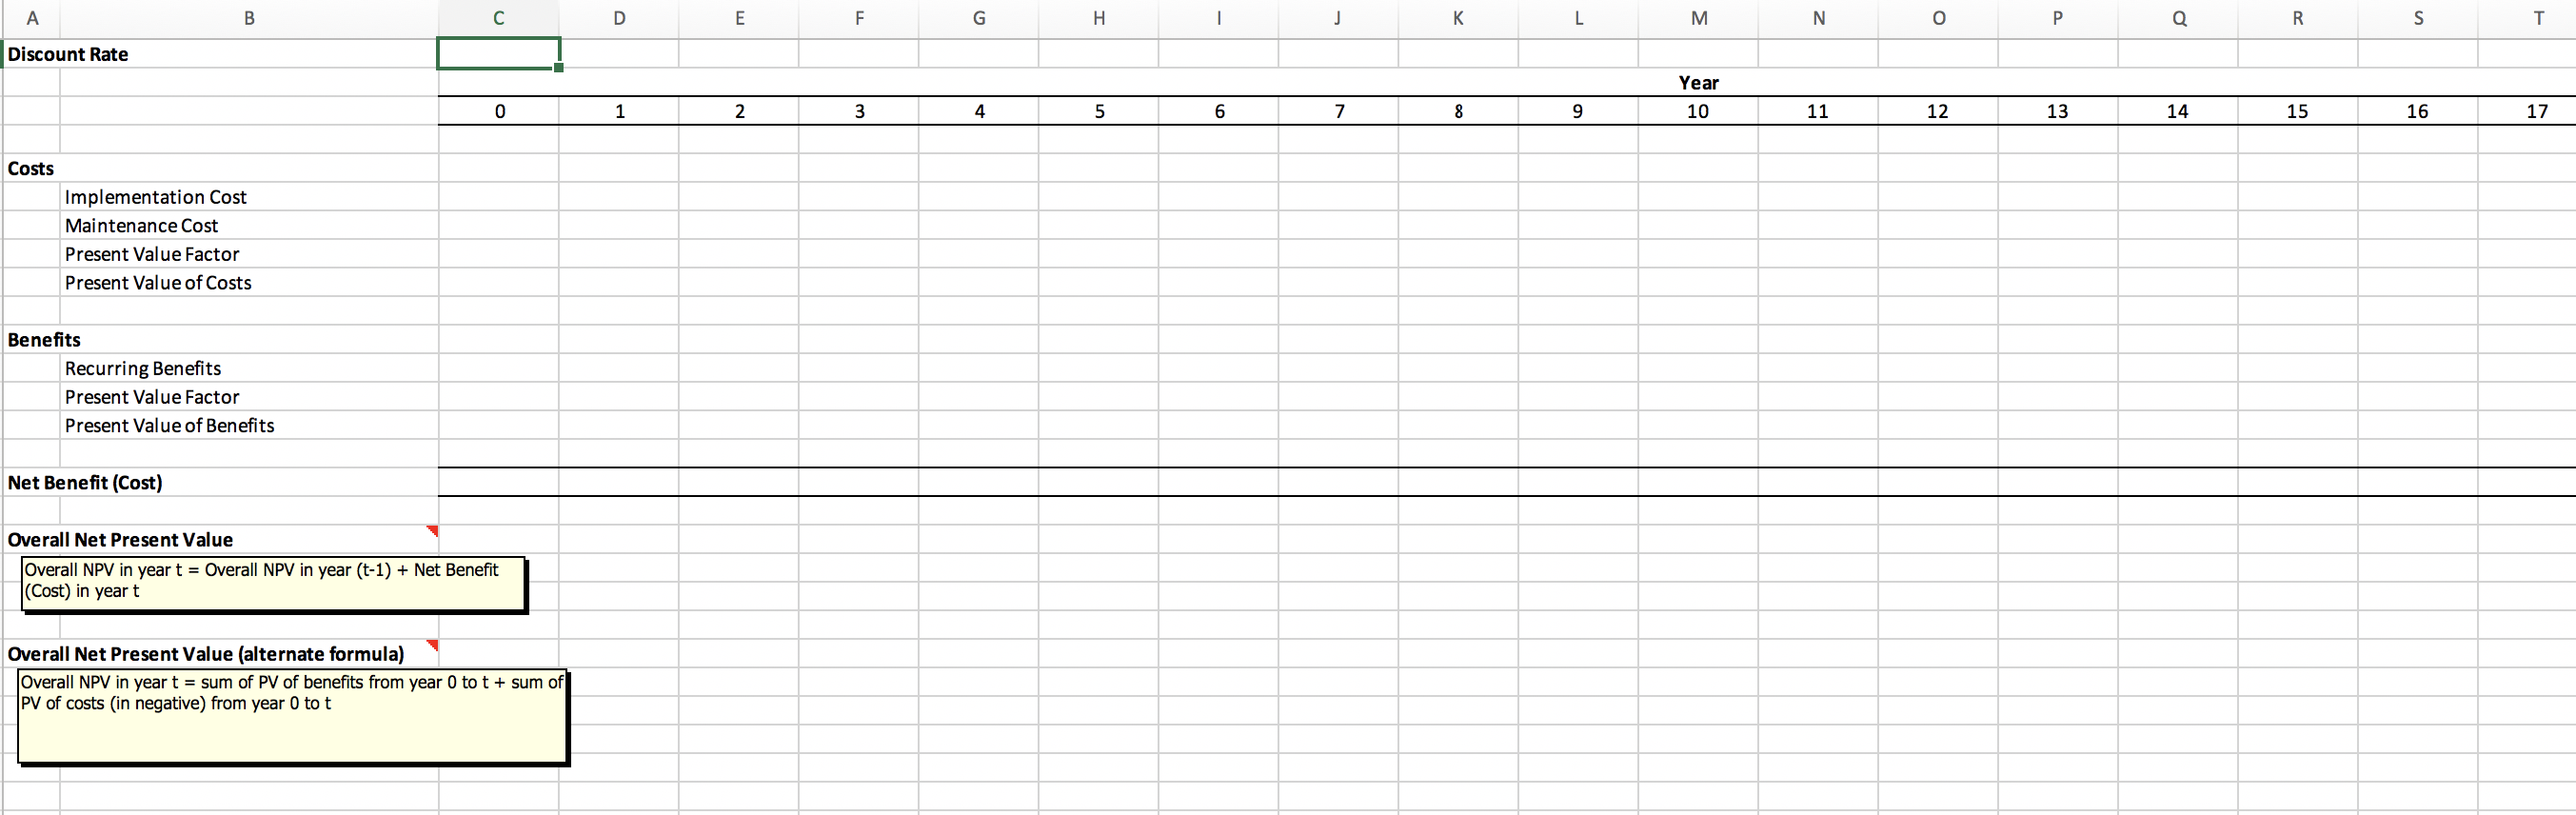
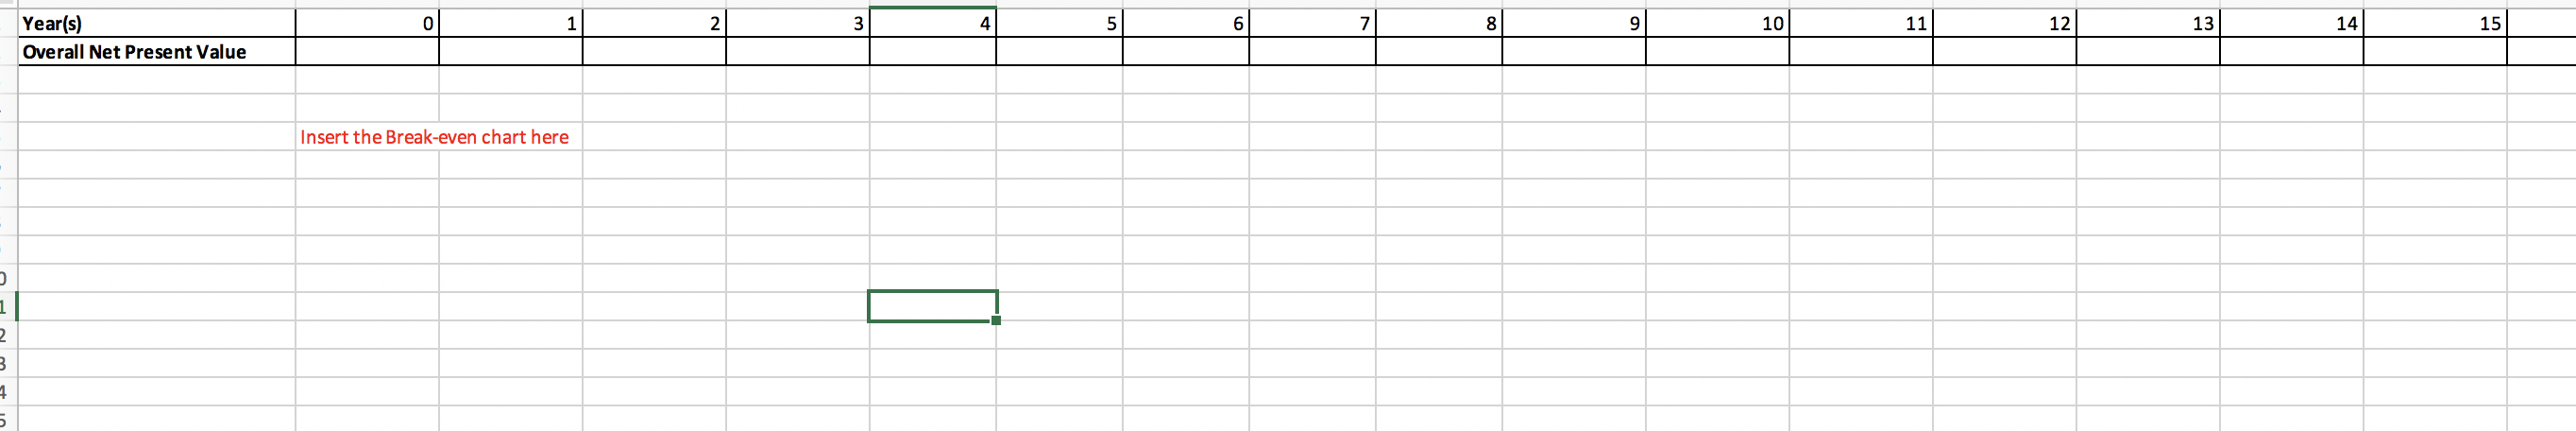
Case 1 - Extreme Mountain Bikes Cost Benefit Analysis Introduction During his junior year in college, Bob Cooper was invited by his friend Tom Newton to go on a mountain biking trip. Bob owned a bike but primarily used it for short trips around campus. He'd never been mountain biking before and did not know what to expect. Tom told him it was a lot of fun and since Tom had been doing it for a couple of years, he could help Bob out. Bob agreed to give it a try and one cool Friday afternoon in the fall, Bob and Tom drove a short distance to a nearby off-road mountain bike trail. Bob was immediately surprised by the extreme ruggedness of the trail. The narrow trail twisted and turned through trees, travelled up and down steep ravines, and contained numerous "rock gardens" through which he was supposed to ride. The challenging terrain made it difficult for Bob to keep his balance and required tremendous focus and concentration. As they continued to ride that afternoon, Bob's comfort level on the bike and trail improved and he began to enjoy the challenges of maneuvering a bike skillfully over rough terrain while being outdoors with friends. It was a fantastic experience and the start of a lifelong passion for mountain biking. Bob graduated from college a short time later and found a job selling life insurance. The pay was good, and the job was stable and secure. His early interest in mountain biking had grown and he rode his bike every morning before going to work. When he wasn't riding, he was spending his spare time maintaining and repairing his collection of three mountain bikes. Bob had purchased three different bikes because he was unable to find a bike to perfectly meet his needs. Each bike he owned had its own strengths and weaknesses. One bike was highly maneuverable, but had problems with overcoming large obstacles. Another bike was good with large obstacles, but was heavy and difficult to maneuver. His third bike excelled at going down large, extremely steep hills but lacked the maneuverability and clearance of his first two bikes. One day Bob was talking to a friend who he had recently sold a life policy to about mountain biking and the friend realized how passionate and knowledgeable Bob was about the activity and asked Bob if had every thought of starting his own business. The client knew an investor who might be willing to back a new company focused on mountain bikes. Bob met with the investor and decided to open a business to design, manufacture, and sell mountain bikes. They decided to name the company Extreme Mountain Bikes (EMB) and the company would focus on selling high performing all around mountain bikes at a reasonable cost. EMB hired employees to help with product design, engineering, accounting, fulfillment, and sales. They quickly developed a prototype bike and approached several local stores about selling the bike. The stores were willing to give it a try and the bikes started to sell. In the first year of business, EMB was able to sell nearly a hundred bikes. Bob realized that his first year success meant there was a market for his product, so he decided to expand aggressively. He had a superior product at a reasonable price. The Problem Bob recognized early on that the success of EMB would depend on the ability of his employees to work together in an integrated fashion providing exceptional customer The following table summarizes the implementation and maintenance costs associated with the project. service. In the beginning when EMB was a small company with 4 employees, it was easy to provide outstanding customer service. However, as EMB grew during the next two years, it expanded its operations to 50 full-time employees and $50,000,000 in revenue, customer service declined, customer complaints increased, and cash flow suffered. Furthermore, the sales team was growing increasingly frustrated because they were promising products to customers they could not deliver. Implementation Costs Software Licenses Hardware Network and Communications Upgrades Training Configuration and Implementation Table 1. Implementations Dollar Amount $500,000 $75,000 $25,000 $25,000 $2,750,000 Your Task When Bob first started the company, he invested in some computer equipment and basic software to help track important information. He was a strong believer in using information systems technology, so he purchased separate software applications to help keep track of data for each of the key functional areas in his organization accounting, sales, and warehouse operations. While these software applications served each functional area well, they lacked integration and required significant manual intervention to perform routine business processes. For example, when the sales team submitted an order in its order tracking software application, the order had to be printed out and delivered to the warehouse and accounting departments for processing. The manual process was problematic and Bob felt it was one of the key reasons for the decline in customer service, Accordingly, he was considering buying an enterprise system like SAP to use throughout the organization. Maintenance Costs Software License Maintenance Fees New IT Employees (2 x 90,000) Table 2. Maintenance Costs Dollar Amount $80,000 $180,000 Before proceeding with the project, Bob has asked you to analyze the economic feasibility of replacing his existing suite of applications with SAP, Bob would like to know if the benefits realized from implementing the new SAP system exceed the costs of buying implementing and using the system. Therefore, you must carefully examine the cost and benefits of replacing the legacy system with SAP. To facilitate your analysis, create a Microsoft Excel workbook detailing the costs of purchasing, configuring, implementing, and supporting the system along with a list of the projected benefits and cost savings. Your analysis should take into account the time value of money and calculate the overall net present value of the costs and benefits assuming a 20-year lifespan of the new system. The present value of a future cash flow may be calculated using the following formula: The Benefits As a result of using the new system, EMB expects to reduce inventory holding costs of raw materials and finished goods as well as dramatically increase their sales yield, which is the number of sales quotes resulting in a sales order, due to increased customer satisfaction, faster response time, dynamic pricing and more efficient procurement, production and fulfillment processes. Prior to using the system, 50% of sales quotes resulted in an order. Using the new system, it is expected that 60% of sales quotes will result in a sales order thereby increasing revenue 10%. Assuming average annual sales of $50,000,000 with an average profit margin of 15%, the new system is expected to contribute $750,000 annually to net income. In addition to increased sales and profits, EMB expects to eliminate the positions of four clerical workers who are responsible for the collection, storage and processing of the documents used to support the manual process. Present Value Factor-atry The following table summarizes the recurring benefits associated with implementing the new system Where. r=discount rate t = time period in years Benefits Increased Profit Due to Increased Sales Reduced Inventory Holdings Costs Reduction in Clerical Workforce (4 x 55,000) Table-enefits Dollar Amount $750,000 $250,000 $220,000 The Costs System costs may be categorized as either implementation costs or maintenances costs. Implementation costs occur only once, during system acquisition and implementation at the beginning of the project, while maintenances costs continue every year as long as the system continues to be used. Assume all implementation costs occur in year 0 and maintenances costs remain constant over the entire 20-year life span of the system. The Deliverables Part 1 - The Excel Workbook Use Excel to create a workbook to perform a cost benefit analysis of the project. The workbook should use fixed and variable cell references where applicable to support rapid assessment of the business case under different assumptions for interest rates, benefits and costs. The workbook should contain the following worksheets. Break-Even Chart Create a chart to graphically depict the break-even point for the project. Break-even occurs when the net present value of all costs equals the net present value of all benefits. Part 2 - Questions to Answer using the Excel Workbook Please answer the following questions using the workbook you created in Part 1. All questions should be answered in a separate Microsoft Word document. Table of Contents This worksheet should describe the purpose of the workbook, list and describe each worksheet in the workbook, indicate the date the workbook was last modified, and provide the name of the person who created the workbook 1. Assume a discount rate of 15%. What is the overall net present value for the project? When will the project break-even? Should EMB move forward with the project and proceed with implementing SAP? Explain your answer. Costs The "Costs" worksheet lists the implementation and maintenances costs for the project contained in Tables 1 and 2. Please calculate and display the sum for each cost category. 2. Assume a discount rate of 30%. What is the overall net present value for the project? When will the project break-even? Should EMB move forward with the project and proceed with implementing SAP? Explain your answer. Benefits The "Benefits" worksheet lists the recurring benefits for the project contained in Table 3. You should also calculate and display the sum of all benefits. 3. Assume the recurring value of benefits due to increased sales was overly optimistic and net income due to increased sales is only $375,000 instead of $750,000. In addition, assume the benefits due to a reduction in inventory holding costs are only $50,000 instead of $250,000. Assuming a discount rate of 15%, what is the overall net present value for the project? When will the project break-even? Should EMB move forward with the project and proceed with implementing SAP? Explain your answer. Cost Benefit Analysis The "Cost Benefit Analysis worksheet contains the discount rate, costs, benefits, present value factor, and the present value of costs and benefits for each year of the project. It should also include the Overall Net Present Value (NPV) for the proposed project, which is the net present value of all benefits minus the net present value of all costs. The following figure illustrates the layout of the "Cost Benefit Analysis" worksheet discussed above. 4. Assume the recurring value of benefits due to increased sales was overly optimistic and net income due to increased sales is only $375,000 instead of $750,000. In addition, assume the benefits due to a reduction in inventory holding costs are $50,000 instead of $250,000. At what discount rate is the project economically feasible? (Please note that the discount rate you calculate must include four decimal places of accuracy eg, 12.3456%). Should EMB move forward with the project and proceed with implementing SAP? What are the implications of the changes to the economic feasibility of the project? Explain your answer. Figure 1 - Cost Benefit Analysis 1 Dollar Amount 2 SR No 3 1 4 2 5 3 6 4 Implementation Costs Implementation Costs Software Licenses Hardware Network and Communications Upgrades Training Configuration and Implementation Total Implementation Cost Dollar Amount 11 SR NO 12 1 13 2 Maintenance Costs Maintenance Costs Software License Maintenance Fees New IT Employees (2 x 90,000) Total Maintenance Cost 14 $0 SR No Dollar Amount Benefits Benefits Increased Profit Due to Increased Sales Reduced Inventory Holdings Costs Reduction in Clerical Workforce Total Benefits $o C D IK L o p q R S T Discount Rate Year 0 10 11 12 13 14 15 16 17 Costs Implementation Cost Maintenance Cost Present Value Factor Present Value of Costs Benefits Recurring Benefits Present Value Factor Present Value of Benefits Net Benefit (Cost) Overall Net Present Value Overall NPV in year t = Overall NPV in year (t-1) + Net Benefit (Cost) in yeart Overall Net Present Value (alternate formula) Overall NPV in year t = sum of PV of benefits from year 0 tot + sum of PV of costs (in negative) from year 0 tot 6 13 Year(s) Overall Net Present Value Insert the Break-even chart here m st in Case 1 - Extreme Mountain Bikes Cost Benefit Analysis Introduction During his junior year in college, Bob Cooper was invited by his friend Tom Newton to go on a mountain biking trip. Bob owned a bike but primarily used it for short trips around campus. He'd never been mountain biking before and did not know what to expect. Tom told him it was a lot of fun and since Tom had been doing it for a couple of years, he could help Bob out. Bob agreed to give it a try and one cool Friday afternoon in the fall, Bob and Tom drove a short distance to a nearby off-road mountain bike trail. Bob was immediately surprised by the extreme ruggedness of the trail. The narrow trail twisted and turned through trees, travelled up and down steep ravines, and contained numerous "rock gardens" through which he was supposed to ride. The challenging terrain made it difficult for Bob to keep his balance and required tremendous focus and concentration. As they continued to ride that afternoon, Bob's comfort level on the bike and trail improved and he began to enjoy the challenges of maneuvering a bike skillfully over rough terrain while being outdoors with friends. It was a fantastic experience and the start of a lifelong passion for mountain biking. Bob graduated from college a short time later and found a job selling life insurance. The pay was good, and the job was stable and secure. His early interest in mountain biking had grown and he rode his bike every morning before going to work. When he wasn't riding, he was spending his spare time maintaining and repairing his collection of three mountain bikes. Bob had purchased three different bikes because he was unable to find a bike to perfectly meet his needs. Each bike he owned had its own strengths and weaknesses. One bike was highly maneuverable, but had problems with overcoming large obstacles. Another bike was good with large obstacles, but was heavy and difficult to maneuver. His third bike excelled at going down large, extremely steep hills but lacked the maneuverability and clearance of his first two bikes. One day Bob was talking to a friend who he had recently sold a life policy to about mountain biking and the friend realized how passionate and knowledgeable Bob was about the activity and asked Bob if had every thought of starting his own business. The client knew an investor who might be willing to back a new company focused on mountain bikes. Bob met with the investor and decided to open a business to design, manufacture, and sell mountain bikes. They decided to name the company Extreme Mountain Bikes (EMB) and the company would focus on selling high performing all around mountain bikes at a reasonable cost. EMB hired employees to help with product design, engineering, accounting, fulfillment, and sales. They quickly developed a prototype bike and approached several local stores about selling the bike. The stores were willing to give it a try and the bikes started to sell. In the first year of business, EMB was able to sell nearly a hundred bikes. Bob realized that his first year success meant there was a market for his product, so he decided to expand aggressively. He had a superior product at a reasonable price. The Problem Bob recognized early on that the success of EMB would depend on the ability of his employees to work together in an integrated fashion providing exceptional customer The following table summarizes the implementation and maintenance costs associated with the project. service. In the beginning when EMB was a small company with 4 employees, it was easy to provide outstanding customer service. However, as EMB grew during the next two years, it expanded its operations to 50 full-time employees and $50,000,000 in revenue, customer service declined, customer complaints increased, and cash flow suffered. Furthermore, the sales team was growing increasingly frustrated because they were promising products to customers they could not deliver. Implementation Costs Software Licenses Hardware Network and Communications Upgrades Training Configuration and Implementation Table 1. Implementations Dollar Amount $500,000 $75,000 $25,000 $25,000 $2,750,000 Your Task When Bob first started the company, he invested in some computer equipment and basic software to help track important information. He was a strong believer in using information systems technology, so he purchased separate software applications to help keep track of data for each of the key functional areas in his organization accounting, sales, and warehouse operations. While these software applications served each functional area well, they lacked integration and required significant manual intervention to perform routine business processes. For example, when the sales team submitted an order in its order tracking software application, the order had to be printed out and delivered to the warehouse and accounting departments for processing. The manual process was problematic and Bob felt it was one of the key reasons for the decline in customer service, Accordingly, he was considering buying an enterprise system like SAP to use throughout the organization. Maintenance Costs Software License Maintenance Fees New IT Employees (2 x 90,000) Table 2. Maintenance Costs Dollar Amount $80,000 $180,000 Before proceeding with the project, Bob has asked you to analyze the economic feasibility of replacing his existing suite of applications with SAP, Bob would like to know if the benefits realized from implementing the new SAP system exceed the costs of buying implementing and using the system. Therefore, you must carefully examine the cost and benefits of replacing the legacy system with SAP. To facilitate your analysis, create a Microsoft Excel workbook detailing the costs of purchasing, configuring, implementing, and supporting the system along with a list of the projected benefits and cost savings. Your analysis should take into account the time value of money and calculate the overall net present value of the costs and benefits assuming a 20-year lifespan of the new system. The present value of a future cash flow may be calculated using the following formula: The Benefits As a result of using the new system, EMB expects to reduce inventory holding costs of raw materials and finished goods as well as dramatically increase their sales yield, which is the number of sales quotes resulting in a sales order, due to increased customer satisfaction, faster response time, dynamic pricing and more efficient procurement, production and fulfillment processes. Prior to using the system, 50% of sales quotes resulted in an order. Using the new system, it is expected that 60% of sales quotes will result in a sales order thereby increasing revenue 10%. Assuming average annual sales of $50,000,000 with an average profit margin of 15%, the new system is expected to contribute $750,000 annually to net income. In addition to increased sales and profits, EMB expects to eliminate the positions of four clerical workers who are responsible for the collection, storage and processing of the documents used to support the manual process. Present Value Factor-atry The following table summarizes the recurring benefits associated with implementing the new system Where. r=discount rate t = time period in years Benefits Increased Profit Due to Increased Sales Reduced Inventory Holdings Costs Reduction in Clerical Workforce (4 x 55,000) Table-enefits Dollar Amount $750,000 $250,000 $220,000 The Costs System costs may be categorized as either implementation costs or maintenances costs. Implementation costs occur only once, during system acquisition and implementation at the beginning of the project, while maintenances costs continue every year as long as the system continues to be used. Assume all implementation costs occur in year 0 and maintenances costs remain constant over the entire 20-year life span of the system. The Deliverables Part 1 - The Excel Workbook Use Excel to create a workbook to perform a cost benefit analysis of the project. The workbook should use fixed and variable cell references where applicable to support rapid assessment of the business case under different assumptions for interest rates, benefits and costs. The workbook should contain the following worksheets. Break-Even Chart Create a chart to graphically depict the break-even point for the project. Break-even occurs when the net present value of all costs equals the net present value of all benefits. Part 2 - Questions to Answer using the Excel Workbook Please answer the following questions using the workbook you created in Part 1. All questions should be answered in a separate Microsoft Word document. Table of Contents This worksheet should describe the purpose of the workbook, list and describe each worksheet in the workbook, indicate the date the workbook was last modified, and provide the name of the person who created the workbook 1. Assume a discount rate of 15%. What is the overall net present value for the project? When will the project break-even? Should EMB move forward with the project and proceed with implementing SAP? Explain your answer. Costs The "Costs" worksheet lists the implementation and maintenances costs for the project contained in Tables 1 and 2. Please calculate and display the sum for each cost category. 2. Assume a discount rate of 30%. What is the overall net present value for the project? When will the project break-even? Should EMB move forward with the project and proceed with implementing SAP? Explain your answer. Benefits The "Benefits" worksheet lists the recurring benefits for the project contained in Table 3. You should also calculate and display the sum of all benefits. 3. Assume the recurring value of benefits due to increased sales was overly optimistic and net income due to increased sales is only $375,000 instead of $750,000. In addition, assume the benefits due to a reduction in inventory holding costs are only $50,000 instead of $250,000. Assuming a discount rate of 15%, what is the overall net present value for the project? When will the project break-even? Should EMB move forward with the project and proceed with implementing SAP? Explain your answer. Cost Benefit Analysis The "Cost Benefit Analysis worksheet contains the discount rate, costs, benefits, present value factor, and the present value of costs and benefits for each year of the project. It should also include the Overall Net Present Value (NPV) for the proposed project, which is the net present value of all benefits minus the net present value of all costs. The following figure illustrates the layout of the "Cost Benefit Analysis" worksheet discussed above. 4. Assume the recurring value of benefits due to increased sales was overly optimistic and net income due to increased sales is only $375,000 instead of $750,000. In addition, assume the benefits due to a reduction in inventory holding costs are $50,000 instead of $250,000. At what discount rate is the project economically feasible? (Please note that the discount rate you calculate must include four decimal places of accuracy eg, 12.3456%). Should EMB move forward with the project and proceed with implementing SAP? What are the implications of the changes to the economic feasibility of the project? Explain your answer. Figure 1 - Cost Benefit Analysis 1 Dollar Amount 2 SR No 3 1 4 2 5 3 6 4 Implementation Costs Implementation Costs Software Licenses Hardware Network and Communications Upgrades Training Configuration and Implementation Total Implementation Cost Dollar Amount 11 SR NO 12 1 13 2 Maintenance Costs Maintenance Costs Software License Maintenance Fees New IT Employees (2 x 90,000) Total Maintenance Cost 14 $0 SR No Dollar Amount Benefits Benefits Increased Profit Due to Increased Sales Reduced Inventory Holdings Costs Reduction in Clerical Workforce Total Benefits $o C D IK L o p q R S T Discount Rate Year 0 10 11 12 13 14 15 16 17 Costs Implementation Cost Maintenance Cost Present Value Factor Present Value of Costs Benefits Recurring Benefits Present Value Factor Present Value of Benefits Net Benefit (Cost) Overall Net Present Value Overall NPV in year t = Overall NPV in year (t-1) + Net Benefit (Cost) in yeart Overall Net Present Value (alternate formula) Overall NPV in year t = sum of PV of benefits from year 0 tot + sum of PV of costs (in negative) from year 0 tot 6 13 Year(s) Overall Net Present Value Insert the Break-even chart here m st in
Step by Step Solution
There are 3 Steps involved in it

Get step-by-step solutions from verified subject matter experts