

Question: Only need help with 1 and 2. Data Table: File name is 04cars.csv (no quotes). I know how to read the file into R but
Only need help with 1 and 2.
Data Table:
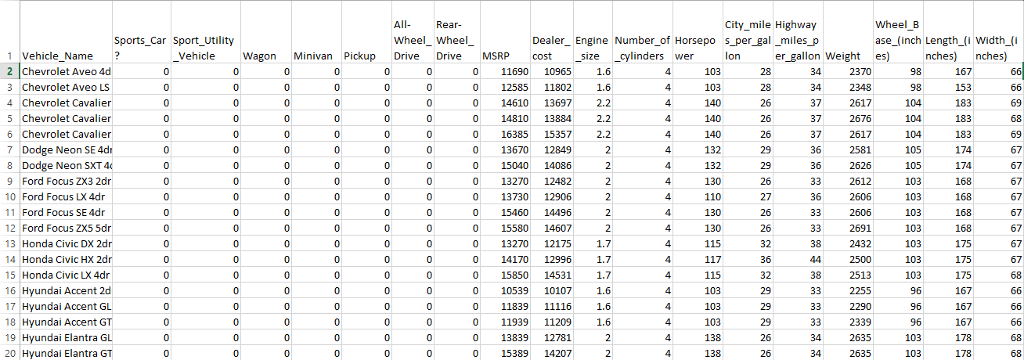
File name is "04cars.csv" (no quotes).
I know how to read the file into R but it gives me an error when I try to plot them. Help me with #1 and 2. I'll try #3 myself.
PS: I dont know how I could upload actual excel (.csv) file here so I had to screenshot the table.
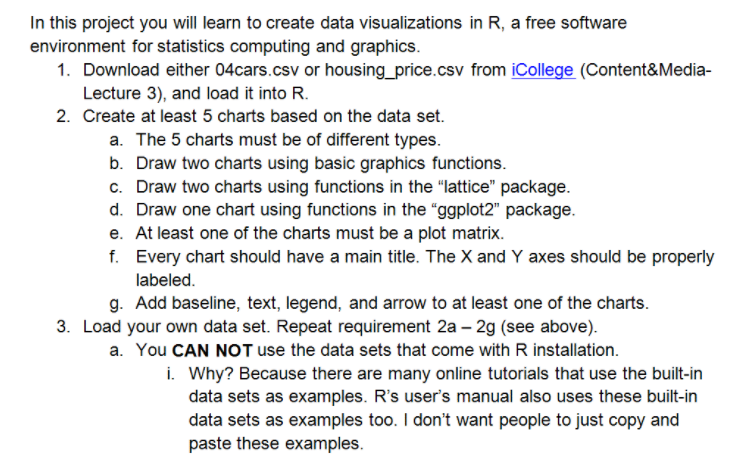
In this project you will learn to create data visualizations in R, a free software environment for statistics computing and graphics 1. Download either 04cars.csv or housing_price.csv from iCollege (Content&Media- Lecture 3), and load it into R 2. Create at least 5 charts based on the data set. a. The 5 charts must be of different types b. Draw two charts using basic graphics functions c. Draw two charts using functions in the "lattice" package d. Draw one chart using functions in the "ggplot2" package e. At least one of the charts must be a plot matrix f. Every chart should have a main title. The X and Y axes should be properly labeled g. Add baseline, text, legend, and arrow to at least one of the charts 3. Load your own data set. Repeat requirement 2a -2g (see above) a. You CAN NOT use the data sets that come with R installation i. Why? Because there are many online tutorials that use the built-in data sets as examples. R's user's manual also uses these built-in data sets as examples too. I don't want people to just copy and paste these examples
Step by Step Solution
There are 3 Steps involved in it

Get step-by-step solutions from verified subject matter experts