

Question: only need help with average days in inventory and the current ratio. everything else is correct!!! The 2018 income statement of Adrian Express reports sales
only need help with average days in inventory and the current ratio. everything else is correct!!!
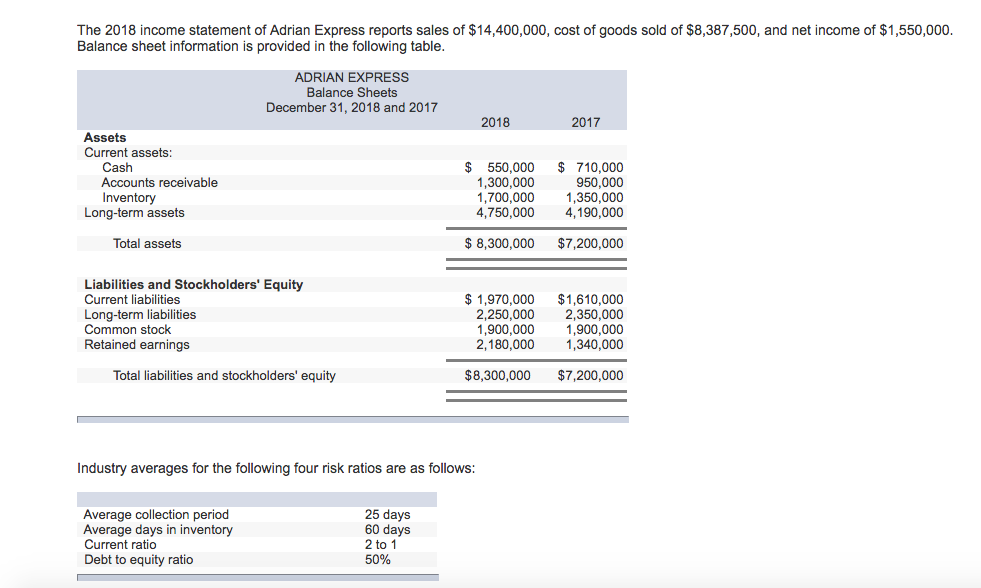
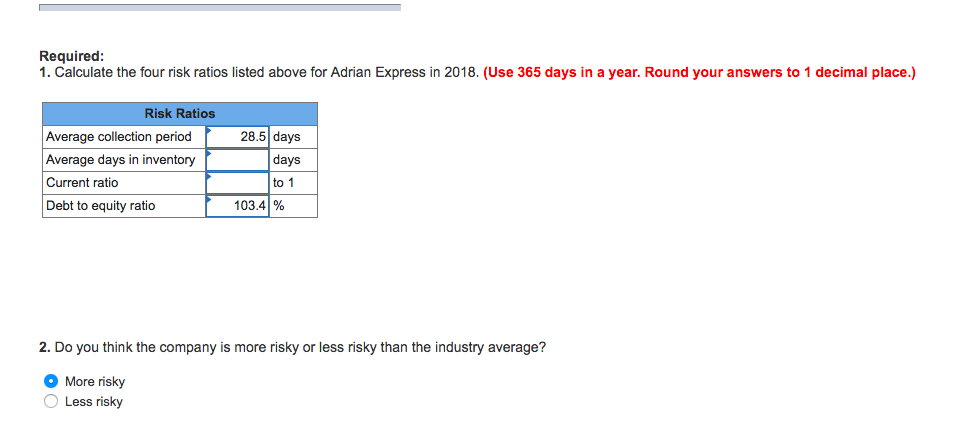
The 2018 income statement of Adrian Express reports sales of $14,400,000, cost of goods sold of $8,387,500, and net income of $1,550,000 Balance sheet information is provided in the following table ADRIAN EXPRESS Balance Sheets December 31, 2018 and 2017 2018 2017 Assets Current assets: Cash Accounts receivable Inventory $ 550,000 $ 710,000 950,000 1,700,000 ,350,000 4,750,000 4,190,000 1,300,000 Long-term assets Total assets $ 8,300,000 $7,200,000 Liabilities and Stockholders' Equity Current liabilities $1,970,000 $1,610,000 2,250,000 2,350,000 1,900,000 2,180,000 1,340,000 Long-term liabilities Common stock 1,900,000 Retained earnings Total liabilities and stockholders' equity $8,300,000 $7,200,000 Industry averages for the following four risk ratios are as follows 25 days 60 days 2 to 1 50% Average collection peri Average days in inventory Current ratio Debt to equity ratio Required 1. Calculate the four risk ratios listed above for Adrian Express in 2018. (Use 365 days in a year. Round your answers to 1 decimal place.) Risk Ratios 28.5 days days 23 1 Average collection period Average days in inventory Current ratio Debt to equity ratio 103.41% 2.Do you think the company is more risky or less risky than the industry average? More risky Less risky
Step by Step Solution
There are 3 Steps involved in it

Get step-by-step solutions from verified subject matter experts