

Question: Only need help with task 2 Here are the prices, listed as price in dollars per crate: Week Very Berry Inc. Ripe N'Juicy Frosh Fruit
Only need help with task 2
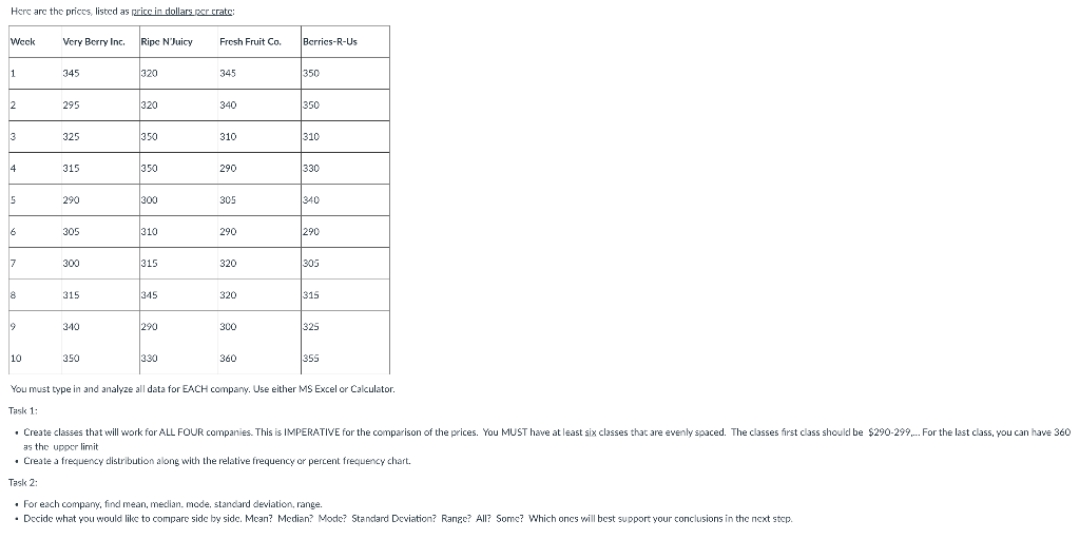
Here are the prices, listed as price in dollars per crate: Week Very Berry Inc. Ripe N'Juicy Frosh Fruit Co. Berrics-R-Us 345 320 345 350 295 320 340 350 325 350 310 310 315 350 290 330 290 300 305 340 305 310 290 290 300 315 320 305 315 345 320 315 340 290 300 325 10 350 330 360 1355 You must type in and analyze all data for EACH company, Use either MS Excel or Calculator. Task 1: . Create classes that will work for ALL FOUR companies. This is IMPERATIVE for the comparison of the prices. You MUST have at least six classes that are evenly spaced. The classes first class should be $290-299.. For the last class, you can have 360 as the upper limit . Create a frequency distribution along with the relative frequency or percent frequency chart. Task 2: . For each company, find mean, median. mode, standard deviation, range. . Decide what you would like to compare side by side. Mean? Median? Mode? Standard Deviation? Range? All? Some? Which ones will best support your conclusions in the next step
Step by Step Solution
There are 3 Steps involved in it

Get step-by-step solutions from verified subject matter experts