

Question: ONLY NEED HELP WITH THE LAST PART Please Help With Missing Parts of Ratio Analysis!! Bob Adkins has recently been approached by his first cousin,
ONLY NEED HELP WITH THE LAST PART
Please Help With Missing Parts of Ratio Analysis!!
Bob Adkins has recently been approached by his first cousin, Ed Lamar, with a proposal to buy a 15% interest in Lamar Swimwear. The firm manufactures stylish bathing suits and sunscreen products.
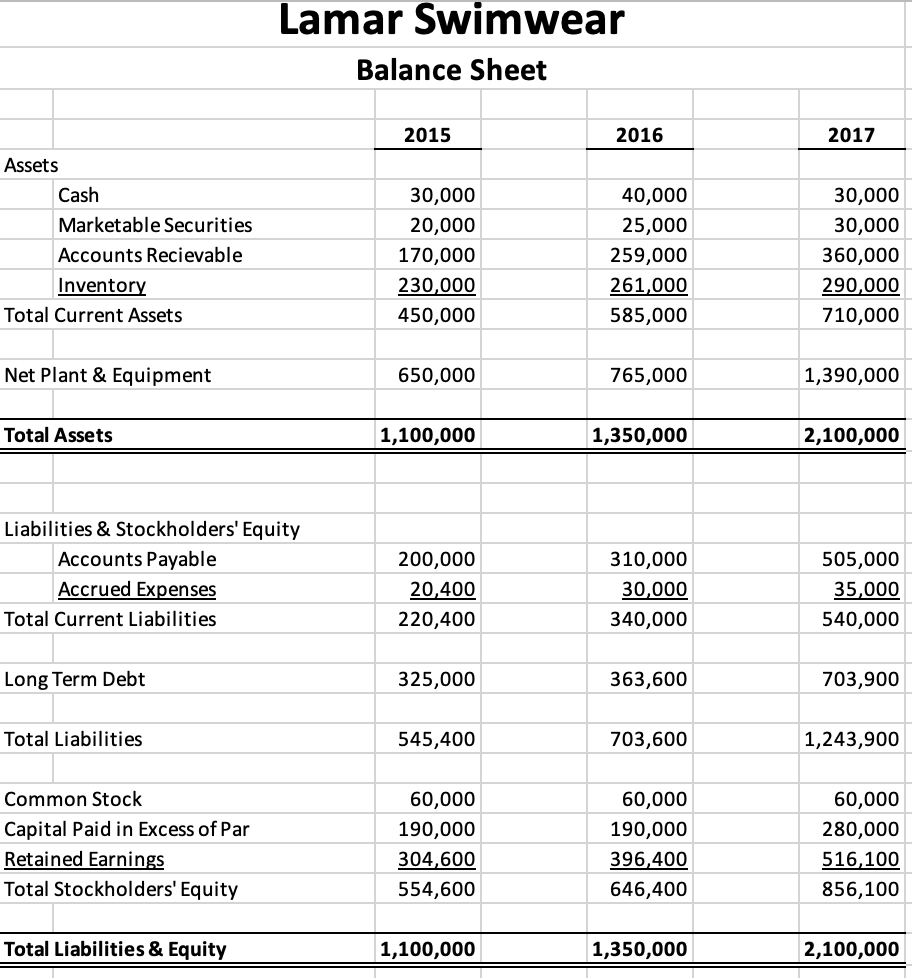
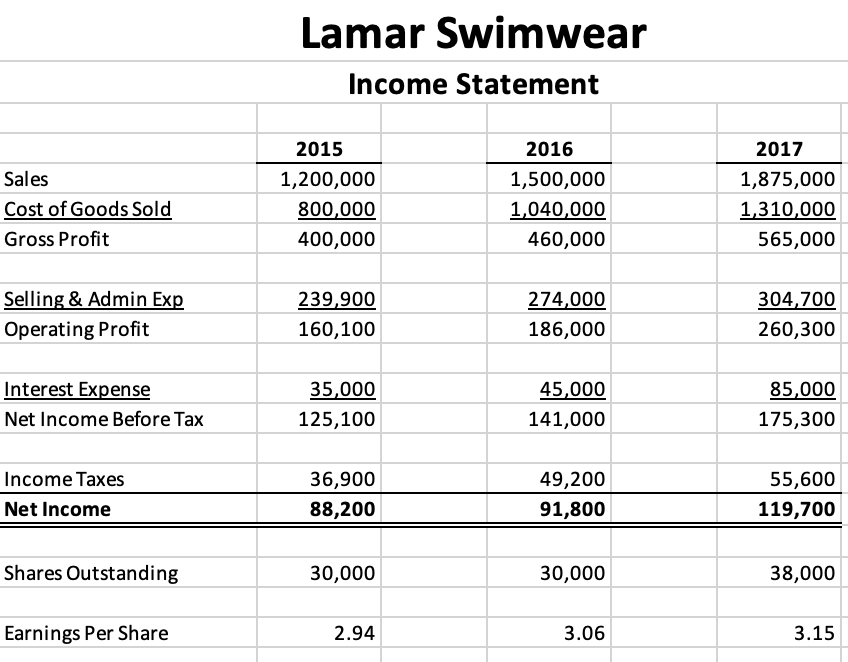
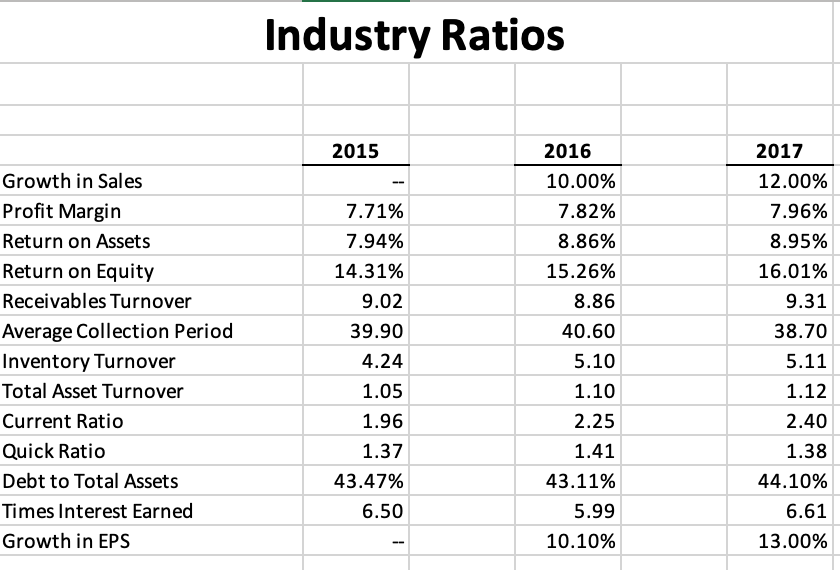
Mr. Lamar is quick to point out the increase in sales that has taken place over the last three years as indicated in the income statement, Exhibit 1. The annual growth rate is 25%. A balance sheet for a similar time period is shown in Exhibit 2, and selected Industry ratios are presented in Exhibit 3. Note the industry growth rate in sales is only 10 to 12 percent per year.
There was a steady real growth of 3 to 4 percent in gross domestic product during the period under study.
The stock in the corporation has become available due to the ill health of a current stockholder, who is in need of cash. The issue here is not to determine the exact price of the stock, but rather, whether Lamar Swimwear represents and attractive investment situation. Although Mr. Adkins has a primary interest in profitability ratios, he will take a close look at all ratios. He has no fast and firm rules about required return on investment, but rather wishes to analyze the overall financial condition of the firm. The firm does not currently pay a cash dividend and return to the investor must come from selling the stock in the future.
Mr. Adkins has asked you to perform a thorough analysis and prepare a report with comments and recommendations do you offer to Mr. Adkins.
THIS IS WHAT I NEED HELP WITH!
I need help solving the empty cells. I was also given these instructions from my professor.
"For calculating the Return on Invested Capital (ROIC) ratio you will need a tax rate. Please calculate the tax rate for each year and use that rate for the corresponding ROIC ratio. (The tax rate will be different for each year). Also, please remember that Total Debt is not the same thing as Total Liabilities.
For growth rate calculations you need a beginning year and an ending year to perform the calculation. This means you will not be able to calculate growth rates for 2015 because you do not have 2014 financial statements."
| Schedule 1 - Financial Ratio Analysis | |||||||||
| Lamar Swimwear | - | - | - | ||||||
| Liquidity | 2015 | 2016 | 2017 | ||||||
| Current Ratio | 2.04 | 1.72 | 1.31 | ||||||
| Quick Ratio | 1.00 | 0.95 | 0.78 | ||||||
| Asset Management | - | - | - | ||||||
| Inventory Turnover | 5.22 | 5.75 | 6.47 | ||||||
| Days Sales Outstanding | 3,333.33 | 4,166.67 | 5,208.33 | ||||||
| Fixed Asset Turnover | 1.85 | 1.96 | 1.35 | ||||||
| Total Asset Turnover | 0.89 | 1.11 | 0.89 | ||||||
| Profitability | - | - | - | ||||||
| Operating Profit Margin | 7.35% | 6.12% | 6.38% | ||||||
| Net Profit Margin | |||||||||
| Return on Assets | 8.02% | 6.80% | 5.70% | ||||||
| Return on Equity | 15.90% | 14.20% | 13.98% | ||||||
| Return on Invested Cap. | |||||||||
| Basic Earning Power | |||||||||
| Debt Management | - | - | - | ||||||
| Debt to Capital | 49.58% | 52.11% | 59.23% | ||||||
| Times Interest Earned | 4.57 | 4.13 | 3.06 | ||||||
| Growth | - | - | - | ||||||
| Growth in Revenue | |||||||||
| Growth in Net Income | |||||||||
| DuPont Identity | ROE | NPM | TAT | EM | |||||
| 2017 | |||||||||
| 2016 | |||||||||
| Actual Change | % | % | |||||||
| % Change | |||||||||
| 2016 | |||||||||
| 2015 | |||||||||
| Actual Change | % | % | |||||||
| % Change | |||||||||
Lamar Swimwear Balance Sheet 2015 2016 2017 Assets Cash Marketable Securities Accounts Recievable Inventory Total Current Assets 30,000 20,000 170,000 230,000 450,000 40,000 25,000 259,000 261,000 585,000 30,000 30,000 360,000 290,000 710,000 Net Plant & Equipment 650,000 765,000 1,390,000 Total Assets 1,100,000 1,350,000 2,100,000 Liabilities & Stockholders' Equity Accounts Payable Accrued Expenses Total Current Liabilities 200,000 20,400 220,400 310,000 30,000 340,000 505,000 35,000 540,000 Long Term Debt 325,000 363,600 703,900 Total Liabilities 545,400 703,600 1,243,900 Common Stock Capital Paid in Excess of Par Retained Earnings Total Stockholders' Equity 60,000 190,000 304,600 554,600 60,000 190,000 396,400 646,400 60,000 280,000 516,100 856,100 Total Liabilities & Equity 1,100,000 1,350,000 2,100,000 Lamar Swimwear Income Statement Sales Cost of Goods Sold Gross Profit 2015 1,200,000 800,000 400,000 2016 1,500,000 1,040,000 460,000 2017 1,875,000 1,310,000 565,000 Selling & Admin Exp Operating Profit 239,900 160,100 274,000 186,000 304,700 260,300 Interest Expense Net Income Before Tax 35,000 125,100 45,000 141,000 85,000 175,300 Income Taxes Net Income 36,900 88,200 49,200 91,800 55,600 119,700 Shares Outstanding 30,000 30,000 38,000 Earnings Per Share 2.94 3.06 3.15 Industry Ratios 2015 2017 12.00% 7.96% 8.95% 16.01% Growth in Sales Profit Margin Return on Assets Return on Equity Receivables Turnover Average Collection Period Inventory Turnover Total Asset Turnover Current Ratio Quick Ratio Debt to Total Assets Times Interest Earned Growth in EPS 9.31 38.70 2016 10.00% 7.82% 8.86% 15.26% 8.86 40.60 5.10 1.10 2.25 7.71% 7.94% 14.31% 9.02 39.90 4.24 1.05 1.96 1.37 43.47% 6.50 5.11 1.12 2.40 1.38 1.41 43.11% 44.10% 5.99 6.61 10.10% 13.00% Lamar Swimwear Balance Sheet 2015 2016 2017 Assets Cash Marketable Securities Accounts Recievable Inventory Total Current Assets 30,000 20,000 170,000 230,000 450,000 40,000 25,000 259,000 261,000 585,000 30,000 30,000 360,000 290,000 710,000 Net Plant & Equipment 650,000 765,000 1,390,000 Total Assets 1,100,000 1,350,000 2,100,000 Liabilities & Stockholders' Equity Accounts Payable Accrued Expenses Total Current Liabilities 200,000 20,400 220,400 310,000 30,000 340,000 505,000 35,000 540,000 Long Term Debt 325,000 363,600 703,900 Total Liabilities 545,400 703,600 1,243,900 Common Stock Capital Paid in Excess of Par Retained Earnings Total Stockholders' Equity 60,000 190,000 304,600 554,600 60,000 190,000 396,400 646,400 60,000 280,000 516,100 856,100 Total Liabilities & Equity 1,100,000 1,350,000 2,100,000 Lamar Swimwear Income Statement Sales Cost of Goods Sold Gross Profit 2015 1,200,000 800,000 400,000 2016 1,500,000 1,040,000 460,000 2017 1,875,000 1,310,000 565,000 Selling & Admin Exp Operating Profit 239,900 160,100 274,000 186,000 304,700 260,300 Interest Expense Net Income Before Tax 35,000 125,100 45,000 141,000 85,000 175,300 Income Taxes Net Income 36,900 88,200 49,200 91,800 55,600 119,700 Shares Outstanding 30,000 30,000 38,000 Earnings Per Share 2.94 3.06 3.15 Industry Ratios 2015 2017 12.00% 7.96% 8.95% 16.01% Growth in Sales Profit Margin Return on Assets Return on Equity Receivables Turnover Average Collection Period Inventory Turnover Total Asset Turnover Current Ratio Quick Ratio Debt to Total Assets Times Interest Earned Growth in EPS 9.31 38.70 2016 10.00% 7.82% 8.86% 15.26% 8.86 40.60 5.10 1.10 2.25 7.71% 7.94% 14.31% 9.02 39.90 4.24 1.05 1.96 1.37 43.47% 6.50 5.11 1.12 2.40 1.38 1.41 43.11% 44.10% 5.99 6.61 10.10% 13.00%
Step by Step Solution
There are 3 Steps involved in it

Get step-by-step solutions from verified subject matter experts