

Question: Only need the answer to part E ABC&D answers provided . The TJX Companies is a Fortune 200 company with 3,860 stores worldwide under half
Only need the answer to part E ABC&D answers provided .
The TJX Companies is a Fortune 200 company with 3,860 stores worldwide under half a dozen retail brand names, including clothing stores such as TJ Maxx and Marshalls. The TJX Companies have fiscal year (FY) that ends in January of each year. The following are TJXs historical (A) and estimated (E) earnings per share (EPS) and dividend per share (DPS). The book value per share of TJX at the beginning of FY 2018 was $3.50.
|
| FY 2018A | FY 2019A | FY 2020E | FY 2021E | FY 2022E |
| EPS | 2.07 | 2.43 | 2.61 | 2.82 | 3.04 |
| DPS | 0.59 | 0.73 | 0.88 | 1.02 | 1.18 |
Assume that TJX has an equity cost of capital of 10 percent per annum and there are no additional shareholder equity transactions.
A. Calculate the ending book value per share for FY 2018 - FY 2022. (2 points)
B. Calculate the return on common equity percentage (ROCE) plus the residual earnings (RE) per share for FY 2018 FY 2022. (3 points)
C. Calculate the year over year (YOY) forecasted growth rates in TJXs residual earnings (RE) growth rates for the period FY 2018 FY 2022. (2 points)
D. Based on your answer in 1C above, in a residual income valuation model would you expect the continuing value to be Case 1, Case 2 or Case 3? Explain briefly. (3 points)
E. Investors use a variety of metrics to help explain value creation within a firm. The metrics, among others, include ROCE, free cash flow, EV/EBITDA, dividend yield, P/E multiples and book value. From a residual income perspective, identify the two primary drivers of value creation for the TJX Companies. Explain how each driver creates value for TJXs shareholders? (4 points)
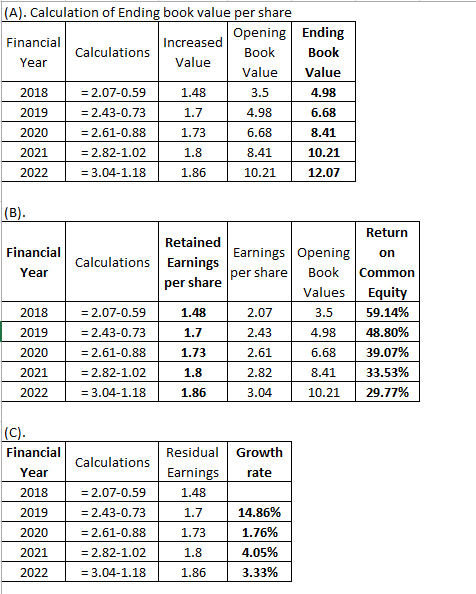
(A). Calculation of Ending book value per share Increased Opening Ending Book Financial Calculations Book Value Year Value Value 2018 =2.07-0.59 1.48 3.5 4.98 2019 2.43-0.73 1.7 4.98 6.68 2020 =2.61-0.88 1.73 6.68 8.41 8.41 2021 = 2.82-1.02 1.8 10.21 10.21 2022 3.04-1.18 1.86 12.07 (B). Return Retained EarningsEarnings Opening per share Financial on Calculations Book Year Common per share Values Equity 59.14% 2018 =2.07-0.59 1.48 2.07 3.5 48.80% 2019 2.43-0.73 1.7 2.43 4.98 39.07% 2020 =2.61-0.88 1.73 2.61 6.68 33.53% 2021 =2.82-1.02 1.8 2.82 8.41 10.21 29.77% 2022 = 3.04-1.18 1.86 3.04 |(C). Financial Residual Growth Calculations Year Earnings rate 2018 =2.07-0.59 1.48 14.86% =2,43-0.73 2019 1.7 1.76% 2020 2.61-0.88 1.73 4.05% 2021 =2.82-1.02 1.8 3.33% 2022 = 3.04-1.18 1.86 (A). Calculation of Ending book value per share Increased Opening Ending Book Financial Calculations Book Value Year Value Value 2018 =2.07-0.59 1.48 3.5 4.98 2019 2.43-0.73 1.7 4.98 6.68 2020 =2.61-0.88 1.73 6.68 8.41 8.41 2021 = 2.82-1.02 1.8 10.21 10.21 2022 3.04-1.18 1.86 12.07 (B). Return Retained EarningsEarnings Opening per share Financial on Calculations Book Year Common per share Values Equity 59.14% 2018 =2.07-0.59 1.48 2.07 3.5 48.80% 2019 2.43-0.73 1.7 2.43 4.98 39.07% 2020 =2.61-0.88 1.73 2.61 6.68 33.53% 2021 =2.82-1.02 1.8 2.82 8.41 10.21 29.77% 2022 = 3.04-1.18 1.86 3.04 |(C). Financial Residual Growth Calculations Year Earnings rate 2018 =2.07-0.59 1.48 14.86% =2,43-0.73 2019 1.7 1.76% 2020 2.61-0.88 1.73 4.05% 2021 =2.82-1.02 1.8 3.33% 2022 = 3.04-1.18 1.86
Step by Step Solution
There are 3 Steps involved in it

Get step-by-step solutions from verified subject matter experts