

Question: only need the one in red x fixed Customers call a call center to make room reservations for a small chain of 42 motels located
only need the one in red x fixed
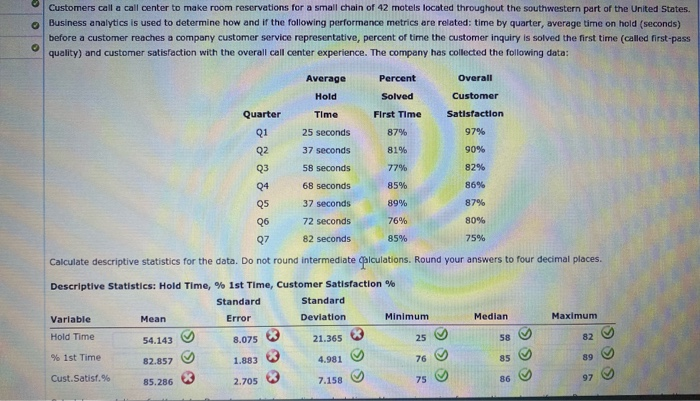
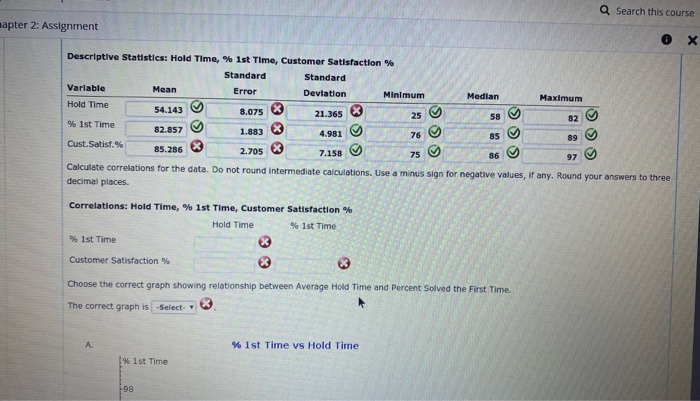
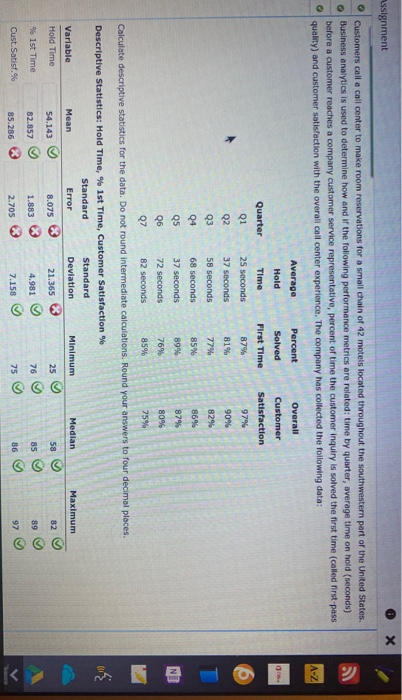
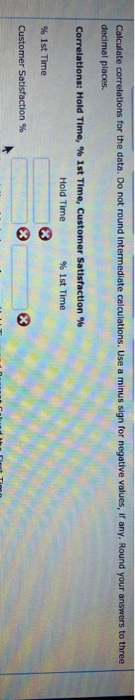
Customers call a call center to make room reservations for a small chain of 42 motels located throughout the southwestern part of the United States. Business analytics is used to determine how and if the following performance metrics are related: time by quarter, average time on hold (seconds) before a customer reaches a company customer service representative, percent of time the customer inquiry is solved the first time (called first-pass quality) and customer satisfaction with the overall call center experience. The company has collected the following data: Average Hold Percent Solved Quarter Time 25 seconds 37 seconds 58 seconds 68 seconds 37 seconds 72 seconds 82 seconds First Time 87% 81% 77% 85% 89% 76% Overall Customer Satisfaction 97% 90% 82% 86% 87% 80% 75% 85% Calculate descriptive statistics for the data. Do not round intermediate alculations. Round your answers to four decimal places. Descriptive statistics: Hold Time, % 1st Time, Customer Satisfaction% Standard Standard Variable Mean Error Deviation Minimum Hold Time Median Maximum 8.075 3 54.143 82.857 21.365 4.981 % 1st Time 1.883 Cust.Satisf.% 85.286 % 7.158 Q Search this course apter 2: Assignment Descriptive Statistics: Hold Time, % 1st Time, Customer Satisfaction Standard Standard Variable Mean Error Deviation Minimum Median Maximum Hold Time 54.143 8.075 X 21.365 Ist Time 1.883 4.981 76 85.286 2.705 7.158 97 Calculate correlations for the data. Do not round intermediate calculations. Use a minus sign for negative values, if any. Round your answers decimal places 82.857 86 Correlations: Hold Time, % 1st Time, Customer Satisfaction% Hold Time % 1st Time % 1st Time Customer Satisfaction% Choose the correct graph showing relationship between Average Hold Time and Percent Solved the First Time The correct graph is - Select % 1st Time vs Hold Time % 1st Time Assignment Customers call a call center to make room reservations for a small chain of 42 motels located throughout the southwestern part of the United States. Business analytics is used to determine how and if the following performance metrics are related: time by quarter, average time on hold (seconds) before a customer reaches a company customer service representative, percent of time the customer inquiry is solved the first time (called first pass quality) and customer satisfaction with the overall call center experience. The company has collected the following data: 81% 90% 87% Average Percent Overall Hold Solved Customer Quarter Time First Time Satisfaction 25 seconds 87% 97% 37 seconds 58 seconds 77% 82% 68 seconds 85% 86% 37 seconds 89% 72 seconds 76% 80% 82 seconds 85% Calculate descriptive statistics for the data. Do not round intermediate calculations. Round your answers to four decimal places. Descriptive Statistics: Hold Time, % 1st Time, Customer Satisfaction% Standard Standard Variable Mean Error Deviation Minimum Hold Time 96 1st Time 82.857 Cust.Satisf.% 85.286 3 75% 8.075 1.883 3 3 21.365 4.981 7.158 2.705 3 Calculate correlations for the data. Do not round intermediate calculations. Use a minus sign for negative values, if any, Round your answers to three decimal places. Correlations: Hold Time, % 1st Time, Customer Satisfaction Hold Time % 1st Time % 1st Time Histaction % 1st Time Customer Satisfaction %
Step by Step Solution
There are 3 Steps involved in it
1 Expert Approved Answer
Step: 1 Unlock

Question Has Been Solved by an Expert!
Get step-by-step solutions from verified subject matter experts
Step: 2 Unlock
Step: 3 Unlock