

Question: Only need to solve 2.12 Use SAS Please 2.2 Using the following data, create a SAS data set calle a statement to compute average blood
Only need to solve 2.12
Use SAS Please
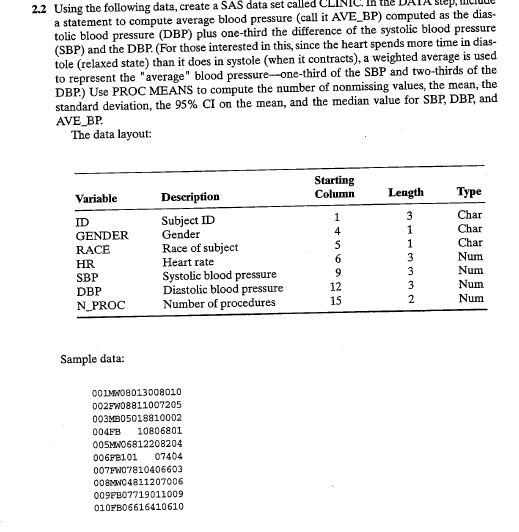
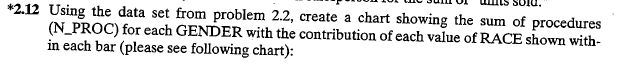
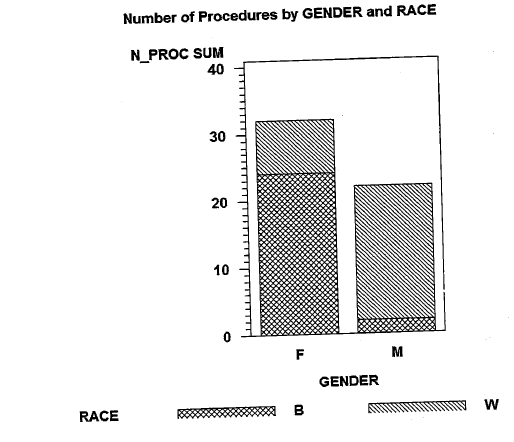
2.2 Using the following data, create a SAS data set calle a statement to compute average blood pressure (call it AVE_BP) computed as the dias- tolic blood pressure (DBP) plus one-third the difference of the systolic blood pressure (SBP) and the DBP. (For those interested in this since the heart spends more time in dias- tole (relaxed state) than it does in systole (when it contracts), a weighted average is used to represent the "average" blood pressure-one-third of the SBP and two-thirds of the DBP.) Use PROC MEANS to compute the number of nonmissing values, the mean, the standard deviation, the 95% CI on the mean, and the median value for SBP, DBP, and AVE_BP. The data layout: Starting Column Variable Length Type ID GENDER RACE HR SBP DBP N_PROC Description Subject ID Gender Race of subject Heart rate Systolic blood pressure Diastolic blood pressure Number of procedures e - = 3 1 1 3 3 3 2 Char Char Char Num Num Num Num Sample data: QOLMN08013008010 002FW08811007205 003MB05018910002 004EB 10806801 005MN06812208204 006FB101 07404 007FW07810406603 008MWO4811207006 009FB07719011009 010FB06616410610 *2.12 Using the data set from problem 2.2, create a chart showing the sum of procedures (N_PROC) for each GENDER with the contribution of each value of RACE shown with- in each bar (please see following chart): Number of Procedures by GENDER and RACE N_PROC SUM 40 30 20 10 0 F M GENDER B RACE W 2.2 Using the following data, create a SAS data set calle a statement to compute average blood pressure (call it AVE_BP) computed as the dias- tolic blood pressure (DBP) plus one-third the difference of the systolic blood pressure (SBP) and the DBP. (For those interested in this since the heart spends more time in dias- tole (relaxed state) than it does in systole (when it contracts), a weighted average is used to represent the "average" blood pressure-one-third of the SBP and two-thirds of the DBP.) Use PROC MEANS to compute the number of nonmissing values, the mean, the standard deviation, the 95% CI on the mean, and the median value for SBP, DBP, and AVE_BP. The data layout: Starting Column Variable Length Type ID GENDER RACE HR SBP DBP N_PROC Description Subject ID Gender Race of subject Heart rate Systolic blood pressure Diastolic blood pressure Number of procedures e - = 3 1 1 3 3 3 2 Char Char Char Num Num Num Num Sample data: QOLMN08013008010 002FW08811007205 003MB05018910002 004EB 10806801 005MN06812208204 006FB101 07404 007FW07810406603 008MWO4811207006 009FB07719011009 010FB06616410610 *2.12 Using the data set from problem 2.2, create a chart showing the sum of procedures (N_PROC) for each GENDER with the contribution of each value of RACE shown with- in each bar (please see following chart): Number of Procedures by GENDER and RACE N_PROC SUM 40 30 20 10 0 F M GENDER B RACE W
Step by Step Solution
There are 3 Steps involved in it

Get step-by-step solutions from verified subject matter experts