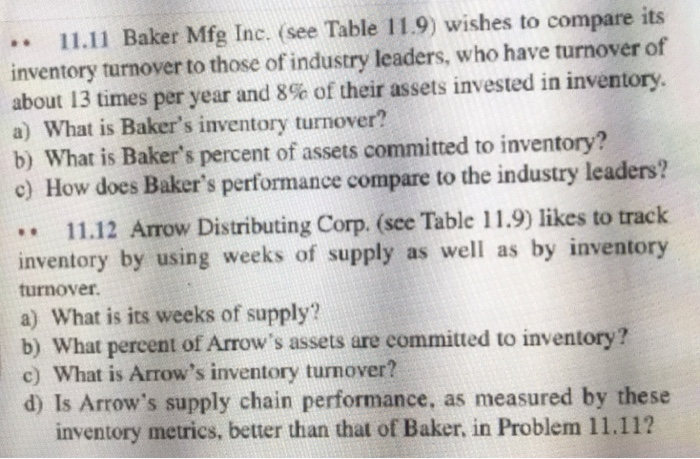
Question: Only question 11.12 Please Table 11.9 For Problems 11.11 and 11.12 . Arrow Distributing Corp. Net revenue ICE Cost of sales Inventory Total assets $16,500

Only question 11.12 Please Only question 11.12 Please Table 11.9 For
Only question 11.12 Please Table 11.9 For
Table 11.9 For Problems 11.11 and 11.12 . Arrow Distributing Corp. Net revenue ICE Cost of sales Inventory Total assets $16,500 $13,500 $ 1.000 $ 8,600 Baker Mfg. Inc. Net revenue Cost of sales Inventory Total assets $27.500 $21.500 $ 1,250 $16,600 .. 11.11 Baker Mfg Inc. (see Table 11.9) wishes to compare its inventory turnover to those of industry leaders, who have turnover of about 13 times per year and 8% of their assets invested in inventory. a) What is Baker's inventory turnover? b) What is Baker's percent of assets committed to inventory? c) How does Baker's performance compare to the industry leaders? 11.12 Arrow Distributing Corp. (see Table 11.9) likes to track inventory by using weeks of supply as well as by inventory turnover. a) What is its weeks of supply? b) What percent of Arrow's assets are committed to inventory? c) What is Arrow's inventory turnover? d) Is Arrow's supply chain performance, as measured by these inventory metrics, better than that of Baker, in Problem 11.112

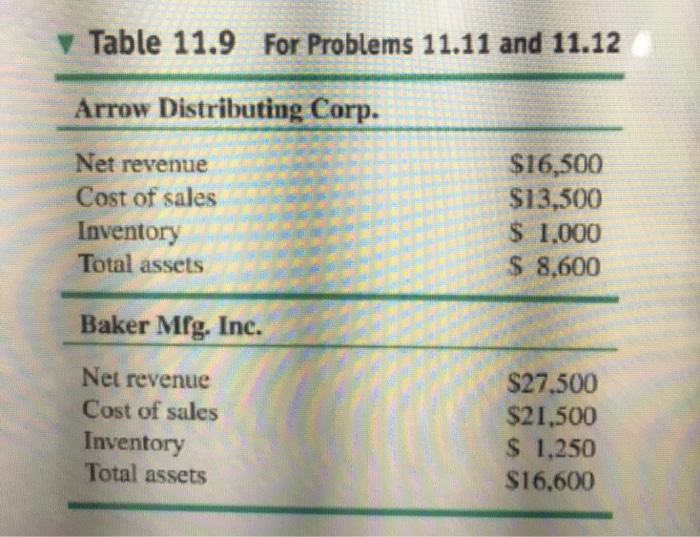
Step by Step Solution

There are 3 Steps involved in it

1 Expert Approved Answer
Step: 1 Unlock blur-text-image
Question Has Been Solved by an Expert!

Get step-by-step solutions from verified subject matter experts

Step: 2 Unlock
Step: 3 Unlock

Students Have Also Explored These Related General Management Questions!