

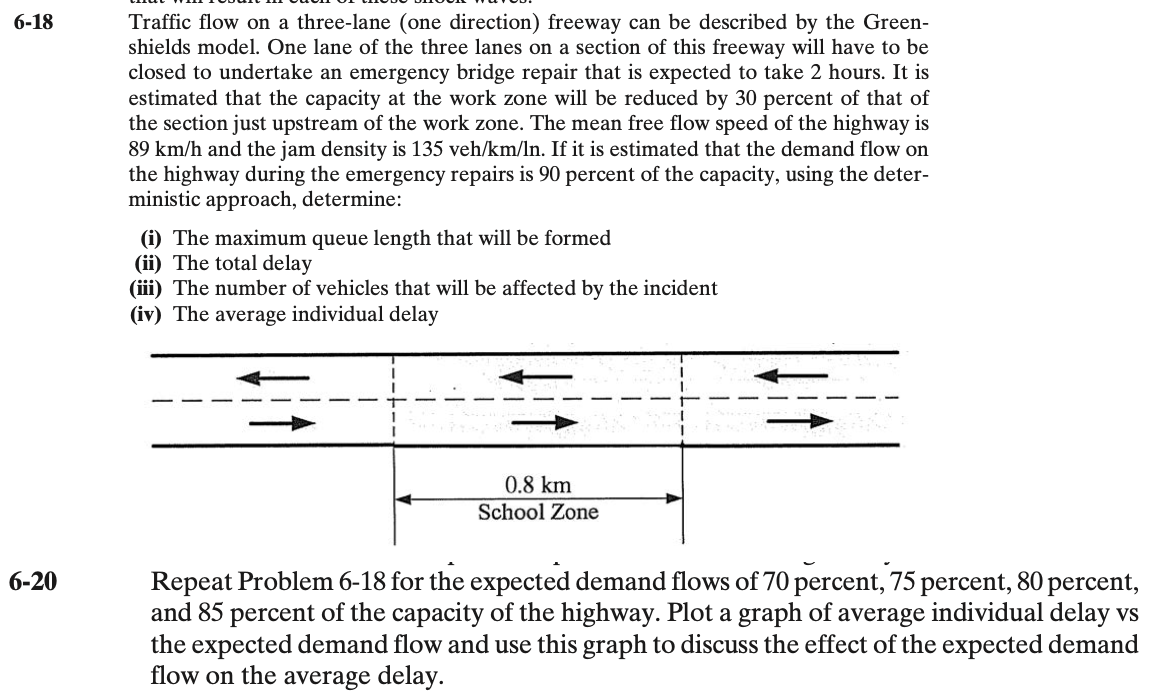
Question: ONLY SOLVE 6 - 2 0 ! Repeat Problem 6 - 1 8 for the expected demand flows of 7 0 percent, 7 5 percent,
ONLY SOLVE Repeat Problem for the expected demand flows of percent, percent, percent,
and percent of the capacity of the highway. Plot a graph of average individual delay vs
the expected demand flow and use this graph to discuss the effect of the expected demand
flow on the average delay.
Step by Step Solution
There are 3 Steps involved in it
1 Expert Approved Answer
Step: 1 Unlock

Question Has Been Solved by an Expert!
Get step-by-step solutions from verified subject matter experts
Step: 2 Unlock
Step: 3 Unlock