

Question: Only the left out question... Please answer I will upvote A monopoly faces the demand curve P = 10-0.50, where P is measured in dollars
Only the left out question... Please answer I will upvote
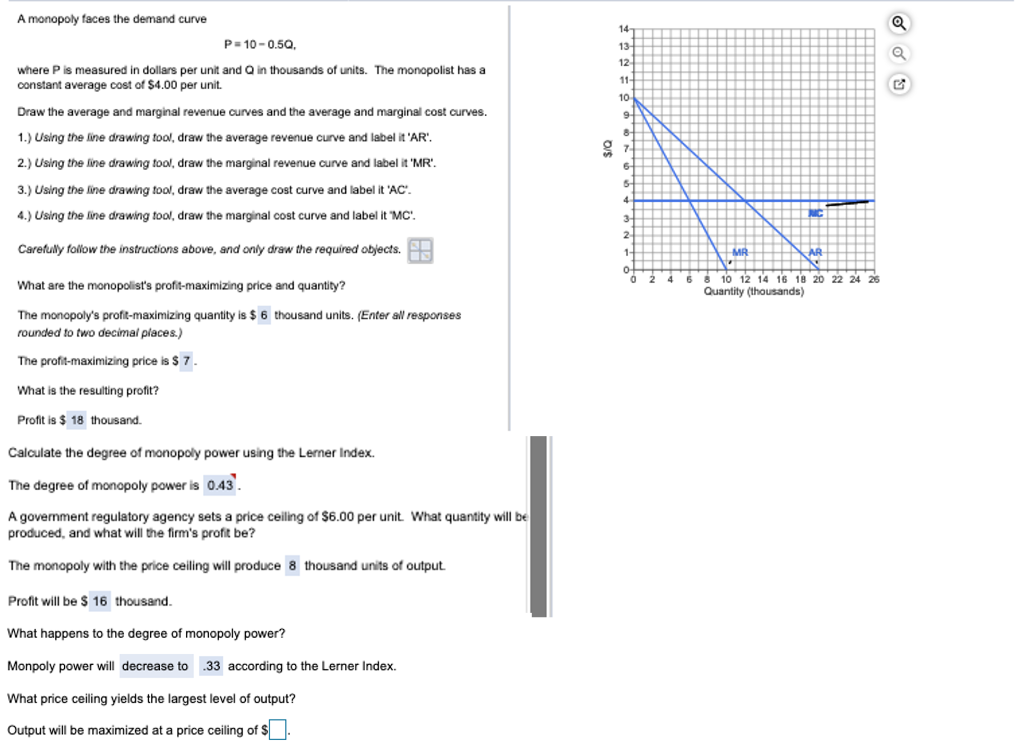
A monopoly faces the demand curve P = 10-0.50, where P is measured in dollars per unit and Q in thousands of units. The monopolist has a constant average cost of $4.00 per unit. Draw the average and marginal revenue curves and the average and marginal cost curves. 1.) Using the line drawing tool, draw the average revenue curve and label it 'AR'. 2.) Using the line drawing fool, draw the marginal revenue curve and label it 'MR'. 3.) Using the line drawing tool, draw the average cost curve and label it 'AC. 4.) Using the line drawing tool, draw the marginal cost curve and label it "MC'. Carefully follow the instructions above, and only draw the required objects. What are the monopolist's profit-maximizing price and quantity? 2 6 8 10 12 14 16 18 20 22 24 Quantity (thousands) The monopoly's profit-maximizing quantity is $ 6 thousand units. (Enter all responses rounded to two decimal places.) The profit-maximizing price is $ 7 . What is the resulting profit? Profit is $ 18 thousand. Calculate the degree of monopoly power using the Lemer Index. The degree of monopoly power is 0.43 . A government regulatory agency sets a price ceiling of $6.00 per unit. What quantity will be produced, and what will the firm's profit be? The monopoly with the price ceiling will produce 8 thousand units of output Profit will be $ 16 thousand. What happens to the degree of monopoly power? Monpoly power will decrease to .33 according to the Lerner Index. What price ceiling yields the largest level of output? Output will be maximized at a price ceiling of $]
Step by Step Solution
There are 3 Steps involved in it

Get step-by-step solutions from verified subject matter experts