

Question: only this picture i have EXAMPLE: 2019 YIELD INVERSION VS S&P 500 Daily Data 1962-01-02 to 2019-03-25 (Log Scale) S&P 500 vs. Yield Curve (10-Year
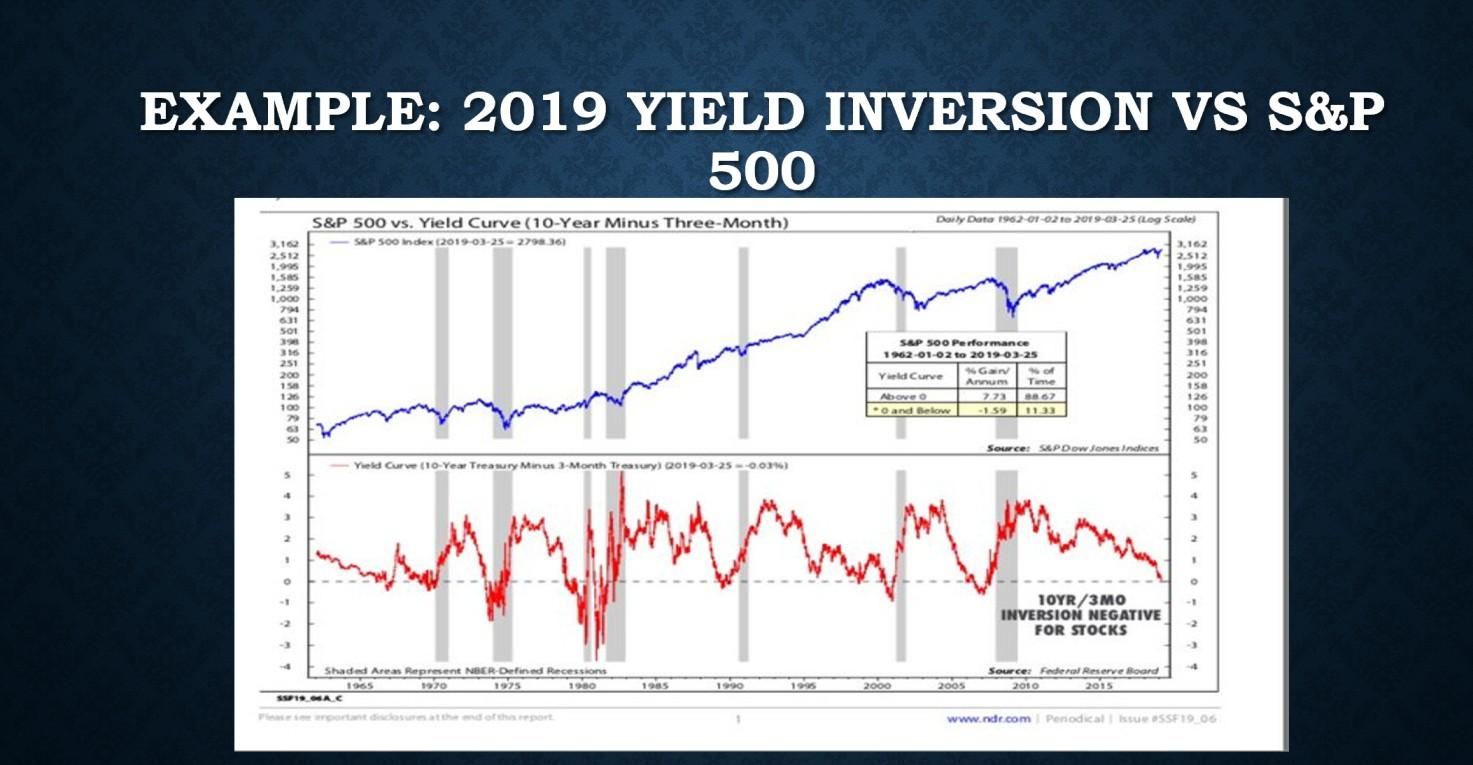
EXAMPLE: 2019 YIELD INVERSION VS S&P 500 Daily Data 1962-01-02 to 2019-03-25 (Log Scale) S&P 500 vs. Yield Curve (10-Year Minus Three-Month) S&P 500 Index (2019-03-25-2798.36) 3,162 3,162 2,512 1,585 2.512 1,995 1,585 1,259 1,259 1,000 1,000 631 501 794 631 501 398 316 251 200 158 126 100 79 63 50 Yield Curve (10-Year Treasury Minus 3-Month Treasury) (2019-03-25--0.03%) Shaded Areas Represent NBER-Defined Recessions 1965 1970 1980 1975 1990 1995 398 316 251 200 158 126 100 79 50 5 4 3 O -1 4 SSP19.06A C Please see mportant disclosures at the end of this report 1985 S&P 500 Performance 1962-01-02 to 2019-03-25 Yield Curve % Gain % of Annum Time 7.73 88.67 Above 0 O and Below -1.59 11.33 Source: S&PDow Jones Indices 10YR/3MO INVERSION NEGATIVE FOR STOCKS Source: Federal Reserve Board 2010 2015 2005 www.ndr.com Periodical Issue #SSF19.06 2000 5 4 3 2 0 -1 EXAMPLE: 2019 YIELD INVERSION VS S&P 500 Daily Data 1962-01-02 to 2019-03-25 (Log Scale) S&P 500 vs. Yield Curve (10-Year Minus Three-Month) S&P 500 Index (2019-03-25-2798.36) 3,162 3,162 2,512 1,585 2.512 1,995 1,585 1,259 1,259 1,000 1,000 631 501 794 631 501 398 316 251 200 158 126 100 79 63 50 Yield Curve (10-Year Treasury Minus 3-Month Treasury) (2019-03-25--0.03%) Shaded Areas Represent NBER-Defined Recessions 1965 1970 1980 1975 1990 1995 398 316 251 200 158 126 100 79 50 5 4 3 O -1 4 SSP19.06A C Please see mportant disclosures at the end of this report 1985 S&P 500 Performance 1962-01-02 to 2019-03-25 Yield Curve % Gain % of Annum Time 7.73 88.67 Above 0 O and Below -1.59 11.33 Source: S&PDow Jones Indices 10YR/3MO INVERSION NEGATIVE FOR STOCKS Source: Federal Reserve Board 2010 2015 2005 www.ndr.com Periodical Issue #SSF19.06 2000 5 4 3 2 0 -1
Step by Step Solution
There are 3 Steps involved in it

Get step-by-step solutions from verified subject matter experts