

Question: ONLY USE R-SOFTWARE OR R-STUDIO TO SOLVE THIS QUESTION An experiment was conducted to study the effect of quality control level (1= low, 2= moderate,
ONLY USE "R-SOFTWARE OR R-STUDIO" TO SOLVE THIS QUESTION
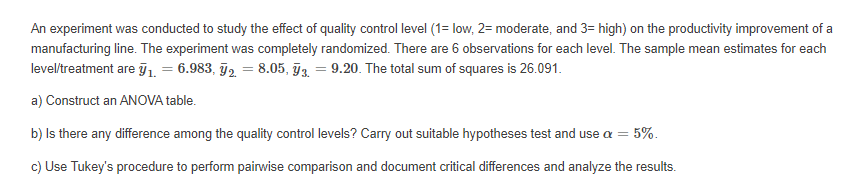
An experiment was conducted to study the effect of quality control level (1= low, 2= moderate, and 3= high) on the productivity improvement of a manufacturing line. The experiment was completely randomized. There are 6 observations for each level. The sample mean estimates for each level/treatment are y. = 6.983, 72. = 8.05, 73. = 9.20. The total sum of squares is 26.091. a) Construct an ANOVA table. b) Is there any difference among the quality control levels? Carry out suitable hypotheses test and use a = 5% c) Use Tukey's procedure to perform pairwise comparison and document critical differences and analyze the results. An experiment was conducted to study the effect of quality control level (1= low, 2= moderate, and 3= high) on the productivity improvement of a manufacturing line. The experiment was completely randomized. There are 6 observations for each level. The sample mean estimates for each level/treatment are y. = 6.983, 72. = 8.05, 73. = 9.20. The total sum of squares is 26.091. a) Construct an ANOVA table. b) Is there any difference among the quality control levels? Carry out suitable hypotheses test and use a = 5% c) Use Tukey's procedure to perform pairwise comparison and document critical differences and analyze the results
Step by Step Solution
There are 3 Steps involved in it

Get step-by-step solutions from verified subject matter experts