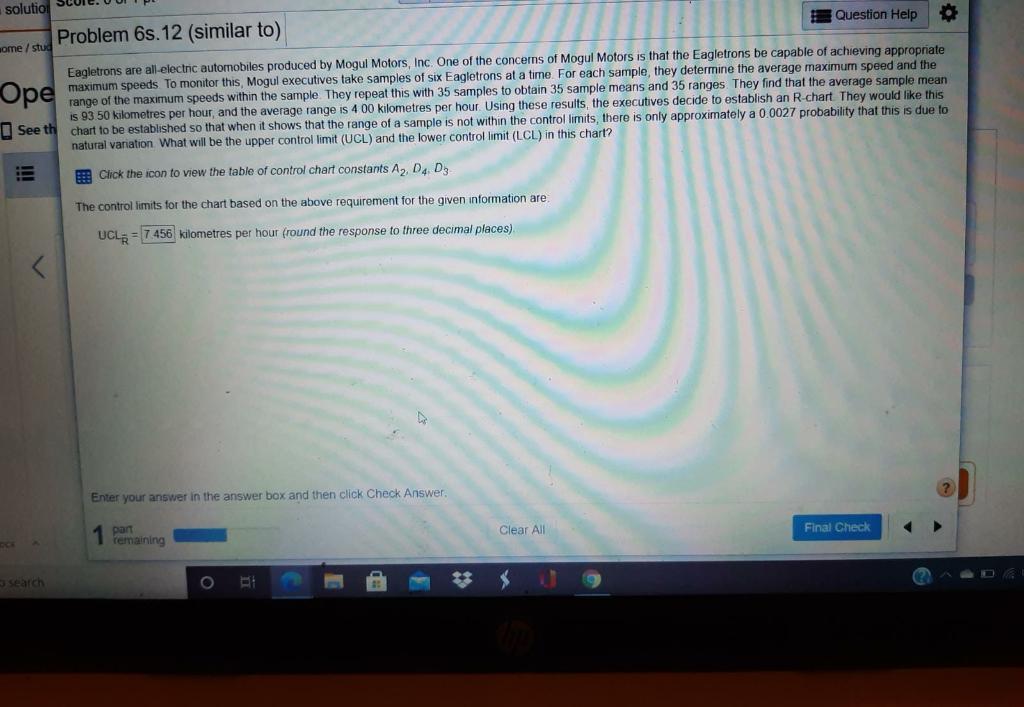
Question: Ope solutio Problem 6s. 12 (similar to) Question Help some / stud Eagletrons are all electric automobiles produced by Mogul Motors, Inc. One of the

Ope solutio Problem 6s. 12 (similar to) QuestionOpe solutio Problem 6s. 12 (similar to) QuestionOpe solutio Problem 6s. 12 (similar to) QuestionOpe solutio Problem 6s. 12 (similar to) Question

Ope solutio Problem 6s. 12 (similar to) Question Help some / stud Eagletrons are all electric automobiles produced by Mogul Motors, Inc. One of the concerns of Mogul Motors is that the Eagletrons be capable of achieving appropriate maximum speeds To monitor this Mogul executives take samples of six Eagletrons at a time. For each sample, they determine the average maximum speed and the range of the maximum speeds within the sample They repeat this with 35 samples to obtain 35 sample means and 35 ranges. They find that the average sample mean is 93 50 kilometres per hour, and the average range is 400 kilometres per hour. Using these results. the executives decide to establish an R-chart They would like this See th chart to be established so that when it shows that the range of a sample is not within the control limits, there is only approximately a 0.0027 probability that this is due to natural variation What will be the upper controllimit (UCL) and the lower controllimit (LCL) in this chart? Eg Click the icon to view the table of control chart constants A2, D4 D3 The control limits for the chart based on the above requirement for the given information are. UCLB = 7.456 kilometres per hour (round the response to three decimal places) Enter your answer in the answer box and then click Check Answer. part Clear All Final Check 1 remaining 3 Search $ ent Problem 6s. 18 (similar to) Question Help ST Five data entry operators work at the data processing department of the Royal Bank Each day for 30 days, the number of defective records in a sample of 250 records typed by these operators has been noted, as follows Sample Sample No. 1 2 2 3 4 5 6 7 8 9 10 No. Defectives 8 . 6 20 11 12 9 12 8 7 14 No. 11 12 13 14 15 16 17 18 19 20 No. Defectives 6 5 17 4 12 8 12 4 19 17 Sample No. 21 22 23 24 25 26 27 28 29 30 No. Defectives 16 11 6 7 12 9 15 6 11 2 a) Establish 30 upper and lower control limits UCL-opter your response as a fraction between 0 and 1 rounded to three decimal places) Incorrect: 0 1 Enter your answer in the answer box and then click Check Answer 3 remaining Clear All Cher Search OBS D) ENG ERSITY ADA WEST Five data entry operators work at the data processing department of the Royal Bank Each day for 30 days, the number of defective records in a sample of 250 records typed by these operators has been noted, as follows + Please copy and paste data from text area below. Selected delimiter: Tab Sample No. Defectives Sample No. Defectives Sample No. Defectives 1 8 11 6 21 16 2 6 12 5 22 11 3 20 13 17 23 6 4 11 14 4 24 7 a) Establish 30 upp 5 12 15 12 25 12 6 9 16 UCL = lent 26 7 12 17 12 27 15 8 8 18 4 28 6 9 7 19 19 29 11 10 14 20 17 30 2 urces 8 9 Incorrec entre ady Modules Done Enter your answer in the answer box and then click Check Answer. 3 remaining Clear All ype here to each elt 18 of 27 (24 complete) HW Score: 88.07%, 23.78 of 27 pts Find solutio Score: 0 of 1 pt Problem 6s. 12 (similar to) Question Help home stud Eagletrons are all electric automobiles produced by Mogul Motors, Inc. One of the concerns of Mogul Motors is that the Eagletrons be capable of achieving appropriate maximum speeds To monitor this, Mogul executives take samples of six Eagletrons at a time for each sample, they determine the average maximum speed and the range of the maximum speeds within the sample. They repeat this with 35 samples to obtain 35 sample means and 35 ranges. They find that the average sample mean is 93.50 kilometres per hour, and the average range is 4.00 kilometres per hour Using these results, the executives decide to establish an R-chart. They would like this See th chart to be established so that when it si a 0.0027 probability that this is due to natural variation What will be the upper More Info E Click the icon to view the table of cd Ope The control limits for the chart based on Sample Size, UCL 7.456 kilometres per hour 2 3 4 4 5 6 Mean Factor, AZ 1.880 1.023 0.729 0.577 0.483 0.419 0.373 0.337 0 308 0.266 Upper Range, D. 3268 2.574 2 282 2 115 2004 1.924 1 864 1.816 Lower Range, D3 0 0 0 0 0 0.076 0.136 0.184 0.223 0.284 7 8 9 10 12 1777 1.716 Print Done Done Enter your answer in the answer box and then click Check Answer. 2 1 par Clear All Final Check

Step by Step Solution

There are 3 Steps involved in it

1 Expert Approved Answer
Step: 1 Unlock blur-text-image
Question Has Been Solved by an Expert!

Get step-by-step solutions from verified subject matter experts

Step: 2 Unlock
Step: 3 Unlock

Students Have Also Explored These Related General Management Questions!