

Question: Open a blank Excel file and create grouped frequency distribution of the maximum daily temperatures for the 50 states for a 30 day period. Use
- Open a blank Excel file and create grouped frequency distribution of the maximum daily temperatures for the 50 states for a 30 day period. Use 8 classes..
- Add midpoint, relative frequency, and cumulative frequency columns to your frequency distribution
- Create frequency histogram using Excel. You will probably need to load the Data Analysis add-in within Excel.
- Ogive in Excel (or by hand).
- A. Any of the temperatures appear to be unrealistic or in error? If yes, which ones and why?B.Explain how this affects your confidence in the validity of this data set
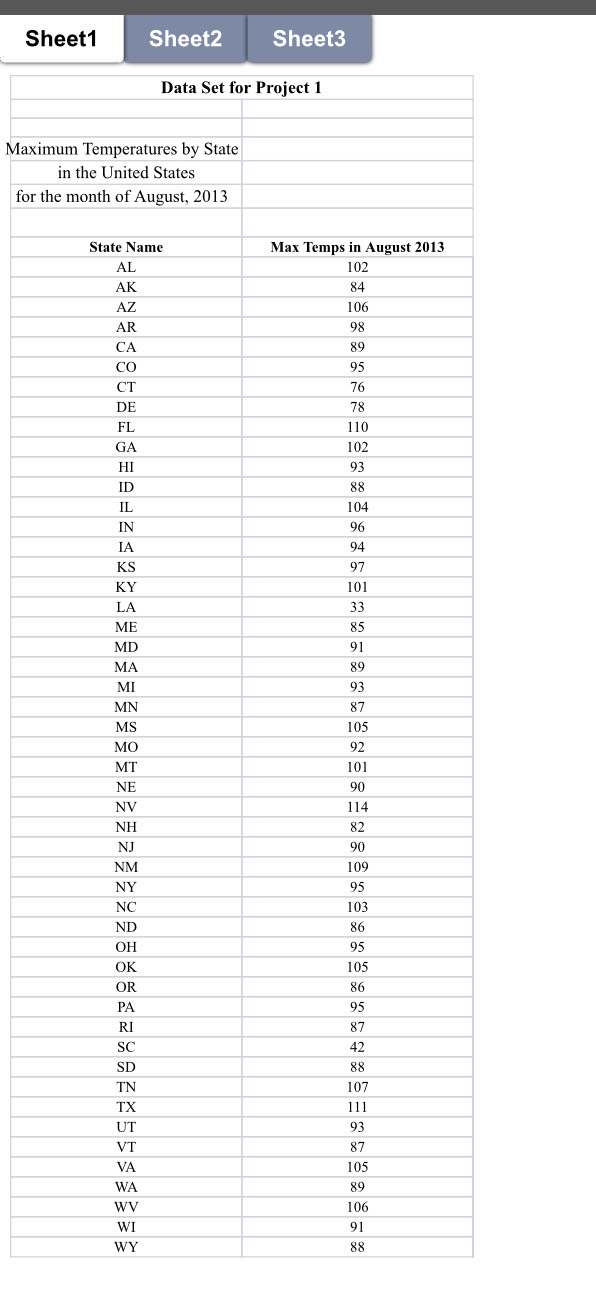
Sheet1 Sheet2 Sheet3 Data Set for Project 1 Maximum Temperatures by State in the United States for the month of August, 2013 State Name Max Temps in August 2013 AL 102 AK 84 AZ 106 AR 98 CA 89 CO 95 CT 76 DE 78 FL 110 GA 102 HI 93 ID 88 IL 104 IN 96 IA 94 KS 97 KY 101 LA 33 ME 85 MD 91 MA 89 MI 93 MN 87 MS 105 MO 92 MT 101 NE 90 NV 114 NH 82 NJ 90 NM 109 NY 95 NC 103 ND 86 OH 95 OK 105 OR 86 PA 95 RI 87 SC 42 SD 88 TN 107 TX 111 UT 93 VT 87 VA 105 WA 89 WV 106 WI 91 WY 88
Step by Step Solution
There are 3 Steps involved in it
1 Expert Approved Answer
Step: 1 Unlock

Question Has Been Solved by an Expert!
Get step-by-step solutions from verified subject matter experts
Step: 2 Unlock
Step: 3 Unlock