

Question: Open Interest Contract Open High hilo Low Settle Chg Cotton (ICE-US)-50,000 lbs: cents per ib. May 78.18 78.35 7732 77.62 -47 July 78.73 78.84 7800
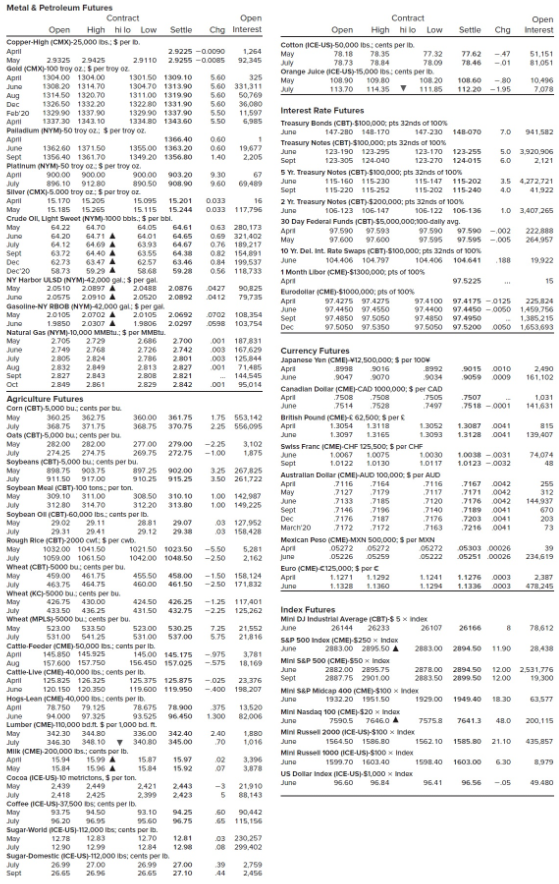
Open Interest Contract Open High hilo Low Settle Chg Cotton (ICE-US)-50,000 lbs: cents per ib. May 78.18 78.35 7732 77.62 -47 July 78.73 78.84 7800 78.46 -01 Orange Juice (ICE-US-15.000 inscents per 108.90 109.30 108.20 103.60 July 113.7011435 111.85 112.20-195 51.151 81,051 May -80 10:496 7078 Aug June 6.0 Interest Rate Futures Treasury Bonds (CBT)-5100.000ptsands of 100% 147.280 148-170 147-230145-070 7.0 941502 Treasury Notes (CBT) $100.000 pts 32nds of 100% June 123-190 123-295 123-170 123-255 5.0 3,920.906 Sept 123-305 124-040 123-270 124-015 2.121 5 Yt. Treasury Notes (CBT) $100,000; pts 32nds of 100% June 115-150115-230 115-147 115-202 3.5 4.272.721 Sept 115-220115-252 115-202115-240 4.0 41.922 2 Ye Treasury Notes (CBT) $200.000pts 32nds of 100% June 106-123 105-147 106-122 106-135 1.0 3.407 265 30 Day Federal Funds CBT) $5,000,000;100 daily avg. April 97.590 97.593 97 590 97.590-002 222.888 May 97.600 97.600 97.595 97.595-005 264.957 10 YI. Del. Int. Rate Swaps (CBT)-$100,000: pts 32nds of 100% June 104.406 104.797 104.406 104 641 188 19.922 1 Month Llber (CME)-$1300.000 pts of 100% April 97.5225 15 Eurodollar CME)-S1000,000pts of 100% April 97.4275 97.4275 974100 97.4175-0125 225.824 June 97.4450 974550 97.4400974450-0050 1459,756 Sept 97.4850 97 5050 97.4850 97.4950 1.385.215 Dec 97.5050 97.5350 975050 97.52000050 1653.693 6422 2.490 161.102 1,031 141631 315 139,407 Metal & Petroleum Futures Contract Open Open High hilo Low Settle hg Irite it Copper-High (CMX 25,000 S: per April 2.9225 -0.0090 1.254 May 29325 29425 2.9110 2.9255 -0.0085 92.345 Gold (CMX-100 try : Sperry on April 130400130400 1301501309.10 5.60 325 June 1308.201314 70 130470 1313.90 5.60 331,311 1314.50 1320.70 131100 1319.90 5.60 50.769 Dec 1326.50 1332.20 132280 1331 90 5.60 36,080 Fab'20 1329 90 1337.90 1329.90 1337.90 550 11.597 Apni 133730 1343.10 1334 80 1343.00 5.50 6,985 Palladium (NYM-50 troy oz: $ per troy oz. April 1366.40 0.60 . June 136260 137150 1355.00 1363.20 0.60 19,677 Sept 1356.40 136170 1349 20 1356.80 1.40 2.205 Platinum (NY)-50 troy oz. $ per troy oz. April 900.00 900.00 900.00 903,20 9:30 896.10 91280 890.50 900.00 9.60 69489 Silver (CMX 5.000 troy or: Sper troy or April 15.170 15.205 15.095 15.201 0.033 16 May 15.185 15.255 15.115 15.244 0.033 117,795 Crude Oil, Light Sweet NYM-1000 bols.: $ per bbl. May 54.70 6405 64.61 0.53 280,173 June 6420 54.71 A 6401 64.65 0.69 321,402 July 64.126469 A 6393 64.67 0.76 100.217 Sept 6372 6440 A 63.55 64.38 0.82 154,891 Dec 62.73 63.47 A 6257 63.46 0.84 199,537 Dec 20 58.73 59.29 A 58.68 59.28 0.56 118.733 NY Harbor ULSD NYM-42.000 gal: $ per gal. May 20510 20897 2048B 2.0876 0427 90,825 June 2.0575 20910 A 2.0520 2.0892 0412 79,735 Gasoline-NY RBOB (NYM)-42.000 gal: $ perga May 2010520702 A 2.0105 2.0692 0702 108,354 June 1.9850 20307 A 1.9806 2.0297 0598 103,754 Natural Gas (NYM-10,000 MMB.: $ por MM May 2705 2.72 2686 2700 001 187831 une 27492.768 2.726 2742 003 167629 July 2805 2.824 2786 2301 003 125.844 Aug 2832 2.849 2813 2827 001 71.485 Sept 2.827 2.843 2.80B 2.821 144.545 Oct 2.8492.861 2.829 2.842 001 95,014 Agriculture Futures Corn (CBT) 5,000 bucents per bu. May 36025362.75 36000 361.75 175 553,142 368.75 37175 368.75 370.75 225 556,095 Oats (CBT)-5,000 bucents per bu 282.00 282.00 277.00 279,00 -225 3.102 July 274 25 27475 269.75 272.75 -100 1.875 Seybeans (CBT)-5.000 bucents per bu Mary 898.75 903.75 897 25 902.00 3.25 267,825 July 911.50 17.00 910.25 915.25 3.50 261,722 Soybean Meal (CET)-100 tons per ton. May 309.10 311.00 306.50 310.10 1.00 142,987 July 3128031470 312 20 313.30 1.00 149.225 Soybean (CBT) 60,000 lbs.: cents per lb. May 29.02 29.11 2881 29.07 03 127.952 29.31 20:41 29.12 29.38 03 158,420 Rough Rice CBT2000 cut: $ per cwb. May 1032.00 104150 102150 1023.50 -5.50 5,281 July 1059.00 106150 104200 1048.50 -250 2.162 Wheat (CBT)-5000 bucents per bu May 450.00 46175 455 50 458.00 -1.50 158. 124 July 463.75 464.75 46000 461.50 -2.50 171,832 Wheat (KCH-5000 bucents per tu. May 426.75 430.00 424.50 426.25 -1.25 117,401 July 433.50 436.25 431.50 432.75 -2.25 125,262 Wheat (MPLS-5000 bu, cents per bu. May 52300 533.50 52300 530.25 725 21,552 July 53100 54125 53100 537.00 5.75 21.016 Cattle Feeder (CME 50.000 lbs, cants perib April 145.850 145.925 14500 145.175 - 975 3.781 Aug 157.600 157.750 156.450 157025 -575 18,169 Cattle-Live CME)-40,000 lbs: cents per ib. April 125.825 126.325 125.375 125.875 -025 23.376 June 120 150 120.250 119.600 119.950 - 400 198.207 Hoge-Lean (CMB) 40,000 is: cents per ib. 78.750 79.125 78.675 78.900 375 13,520 June 94 000 97.325 93.525 96.450 1300 82.006 Lumber (CME-110,000 bd.ft Spor 1.000 bd. It May 342.30 344.80 336.00 342.40 2.40 1,880 346.30 348.10 34080 345,00 70 1,016 MIIK (CME) 200,000 lbs. contsporib. 15.94 15.99 A 15.87 15.97 02 3,396 May 15.84 15.96 A 15.84 15.92 07 3,878 Cocoa ICE-US-10 motrictons. Sporton 2.439 2.449 2.421 2.443 -3 21.910 July 2418 2425 2.399 2.423 5 88.143 Coffee ICE-US-37.500 lbs. cents per ib. May 9375 9450 93.10 94.25 60 90442 July 96.20 96 95 95.60 96.75 65 115,156 Sugar World CE-US-112,000 lbs. cents per la May 12.78 1283 12.70 12.81 03 230.257 July 12.90 12.99 1234 12.90 08 299.402 Sugar-Domestic ICE-US-112,000 lbs: cents per July 27.00 26.99 27.00 39 2.759 Sept 26.65 26.96 26.65 27.10 2,456 May Currency Futures Japanese Yen (CM) 12.500.000 per 100 April 8998 5016 1992 .90150010 June 9047 070 9034 90590009 Canadian Dollar (CME-CAD 1000,000: $ per CAD April 7500 7508 7505 .7507 June 7514 7528 7518-0001 British Pound (CMEM 62,500 $ per April 1.3054 13118 1.3052 1.3087 0041 June 1.3097 3165 1.3093 1.3128 0041 Swiss Franc CME-CHF 125.500: $ per CHF Line 1.0067 10075 10030 1,0038-0031 1.0122 10130 10117 1.0123 -0032 Australian Dollar (CME) AUD 100,000 $ per AUD April 7164 -7116 7167 0042 May 7127 7179 7117 7171 0042 June 7133 7185 7120 7176 0042 Sept 7146 7196 7140 71890041 Dec 7176 7187 7176 7203 0041 March 20 7172 7172 7163 7216 0041 Mexican Peso (CME) MIN 500.000: S per MN Apri 05272 05272 05272 05303 .00026 June 05226 05259 05222 05251 00026 Euro (CME) C125.000; $ per April 1.1271 1.1292 1. 1241 1.1276 0003 June 1.1328 1360 1.1294 1.13360003 74074 48 Sepi 7116 255 312 144.937 670 203 73 39 234619 2.387 478245 Index Futures Mini DJ Industrial Average (CBT)-$5 x index June 26144 26233 26107 26166 8 78.612 S&P 500 Index ICME)-5250 x Index Aine 2883.00 289550 A 2883.00 2094 50 1100 28.438 Mini S&P 500 CME) $50 x Index June 2882.00 2895.75 2878.00 2894.50 12.00 2.531.776 Sept 2887.75 2901.00 288350 2899.50 12.00 19.300 Mini SAP Midea 400 CME-3100 x Index June 1932.20 1951.50 1929.00 1949.40 18.30 63577 Mini Nasdaq 100 CME) $20 x Index June 7590.5 76460 A 7575.8 7641.3 48.0 200.115 Mini Russel 2000 (ICE-US-$100 x Index 1564.50 1586.80 1562.10 1585.80 21.10 435.857 Mini Russell 1000 ICE-US-$100 x index June 1599.70 1603.40 159.40 1603.00 630 8.979 US Dollar Index (ICE-US-SLOCO x Index 96.60 96.84 96.56 -05 49.480 June You are long 20 July 2019 soybean futures contracts. Calculate your dollar profit or loss from this trading day. (A negative value should be indicated by a minus sign. Do not round intermediate calculations.) Gain/Loss by
Step by Step Solution
There are 3 Steps involved in it

Get step-by-step solutions from verified subject matter experts