

Question: Open the attached Excel workbook. There are two sheets with all the data. Since it is difficult to draw the control limit lines in an
Open the attached Excel workbook. There are two sheets with all the data. Since it is
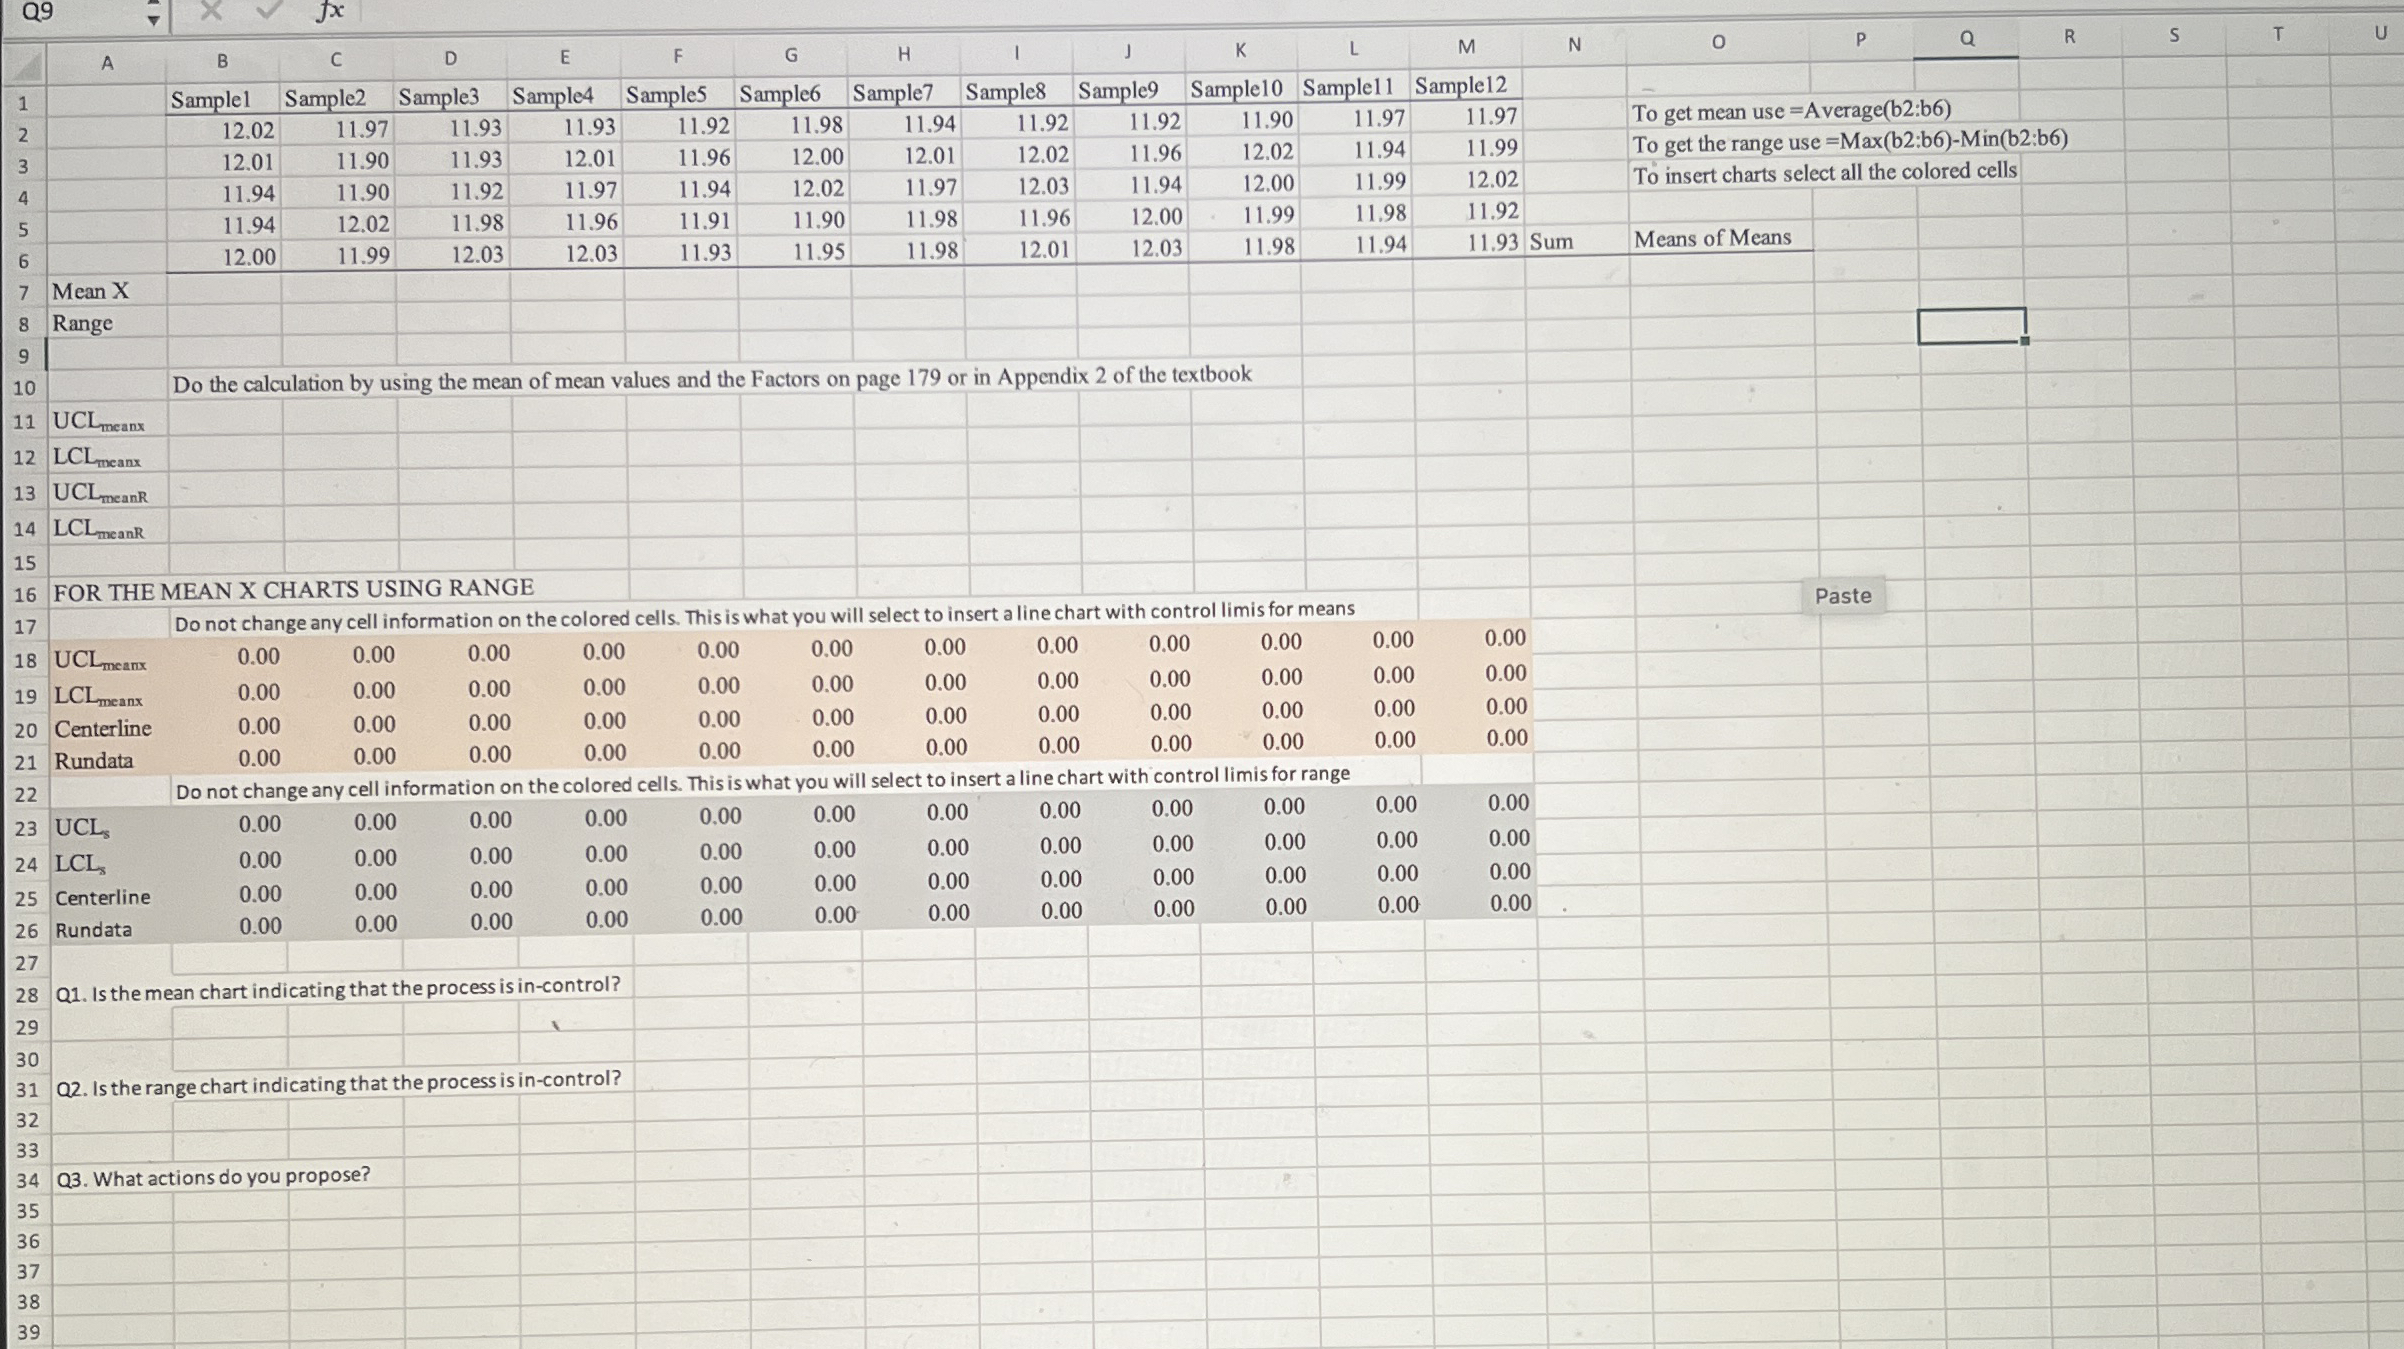
difficult to draw the control limit lines in an Excel chart, I made it easy by formulating
the worksheet so that the charts will show the control lines. Do not change any data in
the colored cells.
In a manufacturing operation a particular part needs to have close tolerances to fit into
the bushings of the next operation. The part is produced but does not always comply
with specifications. This problem seriously disrupts the total production output of
completed items.
During the day samples of units each when you use the table of factors for
computing control limits were collected during a shift. The data for the measurements
is in the Excel File that is attached to the assignment.
On each of the sheets calculate the average and range or standard deviation for each
sample group. On the sheet you will find advice about the formulas to use.
Then calculate the Upper and Lower control limits using the formulas on page of
the textbook. If your electronic version of the book has different page numbers, it is the
last page before the Chapter Problems in Chapter
Once you have calculated the control limits the colored areas will be populated with
your data. Select all the cells in a specificcolored area and then click insert chart and
select line chart. The run charts will be displayed with the Control lines and Center line
on the chart. Evaluate the charts and write in the answers on the Excel sheet in the
areas below the questions.
Do this for both sheets, save your work in a file that you will be able to upload to
Blackboard.
Step by Step Solution
There are 3 Steps involved in it
1 Expert Approved Answer
Step: 1 Unlock

Question Has Been Solved by an Expert!
Get step-by-step solutions from verified subject matter experts
Step: 2 Unlock
Step: 3 Unlock