

Question: Open the Energy Skate Park simulation by opening https://phet.colorado.edu/en/simulation/legacy/energy-skate-park Change the settings on the simulation so that they match the settings in the image below:
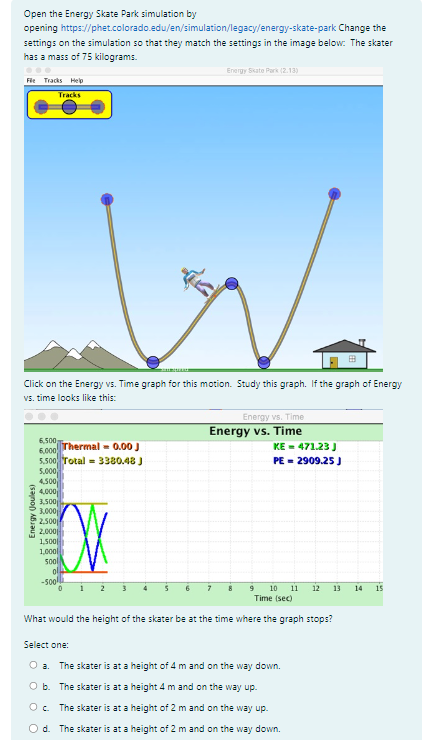
Open the Energy Skate Park simulation by opening https://phet.colorado.edu/en/simulation/legacy/energy-skate-park Change the settings on the simulation so that they match the settings in the image below: The skater has a mass of 75 kilograms. Endroy Beato Park (2.13) File Tracks Help Tracks Click on the Energy vs. Time graph for this motion. Study this graph. If the graph of Energy vs. time looks like this: Energy vs. Time Energy vs. Time 6,500 6.000 Thermal = 0.00 ] KE - 471.23 J 5.500 Total = 3380.48 J PE = 2909.25 J 5.000 4.500 # 4,000 3.500 1.000 Energy 2.500 2.0001 1 500 1 000 sool -5001 2 7 9 10 11 12 13 14 15 Time (sec) What would the height of the skater be at the time where the graph stops? Select one: O a. The skater is at a height of 4 m and on the way down. O b. The skater is at a height 4 m and on the way up. O c. The skater is at a height of 2 m and on the way up. O d. The skater is at a height of 2 m and on the way down
Step by Step Solution
There are 3 Steps involved in it

Get step-by-step solutions from verified subject matter experts