

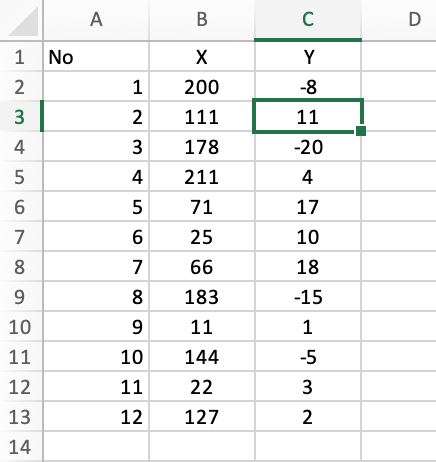
Question: Open the Excel worksheet Q9. In this data set there are 12 different observations. In the same data set x and y represent independent and
- Open the Excel worksheet Q9. In this data set there are 12 different observations. In the same data set x and y represent independent and dependent variables, respectively. Develop a regression model which best represents the data set. You can develop a linear or a polynomial regression model. However, you cannot exceed a degree 3 exponential regression model. In other words, your options are limited to degree 1, 2 and 3 regression models. (5+5+5=15 marks)
- Developed a scatter chart and explain based on the scatter chart what kind of regression model is potentially suitable for development?
- Develop potential regression models and choose the best one. Write the regression equation which you think best represents your data set. Explain why the model you picked is the best one.
- Develop residual plots for all of the regression models and explain if they can help you in choosing appropriate regression model or not.
Step by Step Solution
There are 3 Steps involved in it
1 Expert Approved Answer
Step: 1 Unlock

Question Has Been Solved by an Expert!
Get step-by-step solutions from verified subject matter experts
Step: 2 Unlock
Step: 3 Unlock