

Question: Open transportation sheet in Prep 2.2 Excel file. (1 point) The citys Department of Transportation has been keeping track of accidents on a particularly dangerous
Open transportation sheet in Prep 2.2 Excel file. (1 point)
The citys Department of Transportation has been keeping track of accidents on a particularly dangerous stretch of highway. Early in this year, the city lowered the speed limit on this highway and increased police patrols. Data on number of accidents before and after the changes are presented in the Excel sheet. Did the change work? Is the highway safer? Construct a line chart in Excel to display these two sets of data and write a paragraph (150 words) describing the changes.
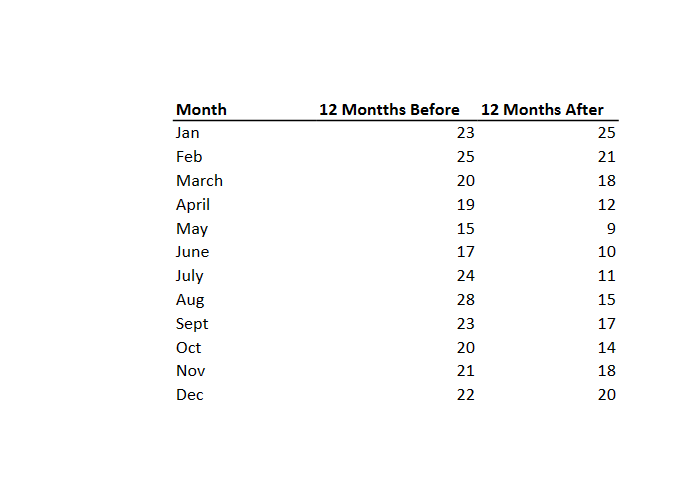
\begin{tabular}{lrr} Month & 12 Montths Before & 12 Months After \\ \hline Jan & 23 & 25 \\ Feb & 25 & 21 \\ March & 20 & 18 \\ April & 19 & 12 \\ May & 15 & 9 \\ June & 17 & 10 \\ July & 24 & 11 \\ Aug & 28 & 15 \\ Sept & 23 & 17 \\ Oct & 20 & 14 \\ Nov & 21 & 18 \\ Dec & 22 & 20 \end{tabular}
Step by Step Solution
There are 3 Steps involved in it

Get step-by-step solutions from verified subject matter experts