

Question: Operating data for Culver Corporation are presented below. 2020 2019 Sales revenue $850,000 $600,000 Cost of goods sold 600,100 420,600 Selling expenses 139,400 78,000 Administrative
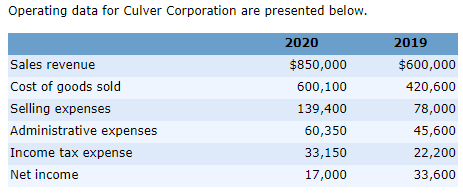
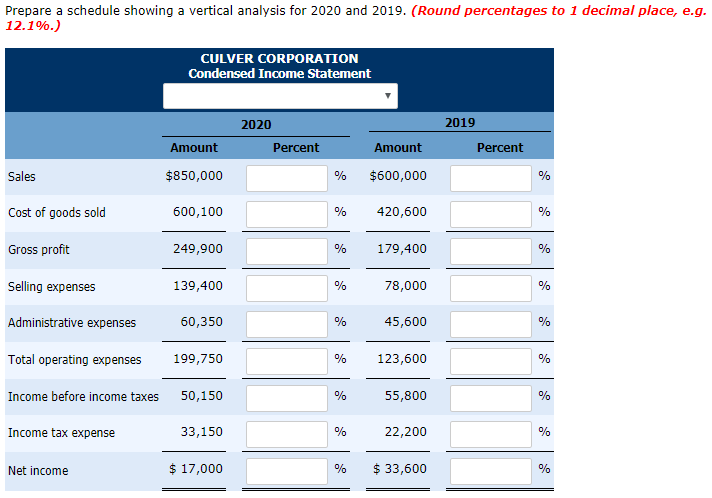
Operating data for Culver Corporation are presented below. 2020 2019 Sales revenue $850,000 $600,000 Cost of goods sold 600,100 420,600 Selling expenses 139,400 78,000 Administrative expenses 60,350 45,600 Income tax expense 33,150 22,200 Net income 17,000 33,600 Prepare a schedule showing a vertical analysis for 2020 and 2019. (Round percentages to 1 decimal place, e.g. 12.1%.) CULVER CORPORATION Condensed Income Statement 2019 2020 Amount Percent Amount Percent $850,000 $600,000 Sales % Cost of goods sold 600,100 % 420,600 % Gross profit 249,900 % 179,400 % Selling expenses 139,400 78,000 % Administrative expenses 60,350 % 45,600 Total operating expenses 123,600 199,750 50,150 Income before income taxes 55,800 % Income tax expense 33,150 % 22,200 % $17,000 33,600 % Net income
Step by Step Solution
There are 3 Steps involved in it

Get step-by-step solutions from verified subject matter experts