

Question: Operating Leverage Example Consider firms A, B and C, all operating in the same industry and with identical revenues in all phases of the
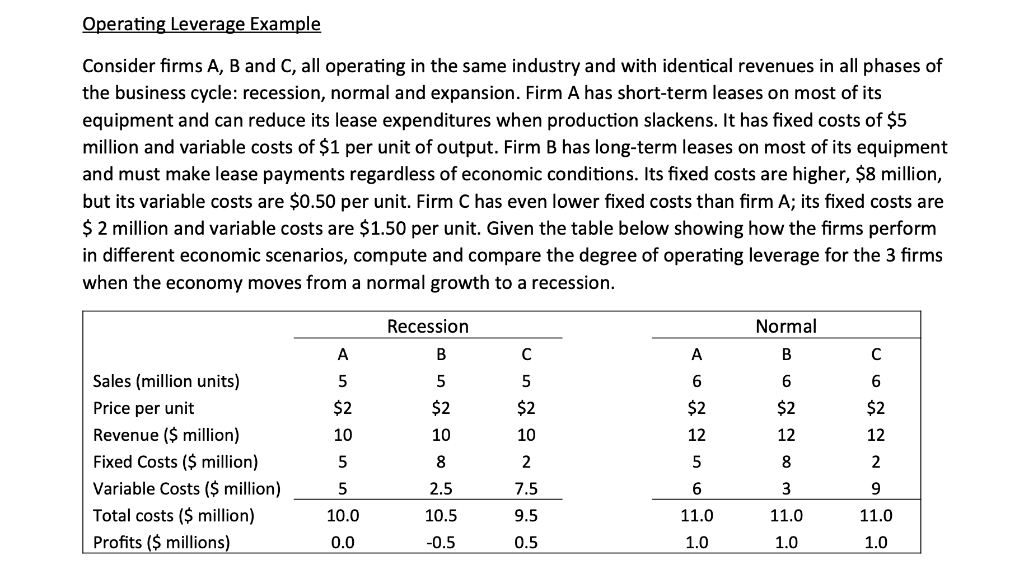
Operating Leverage Example Consider firms A, B and C, all operating in the same industry and with identical revenues in all phases of the business cycle: recession, normal and expansion. Firm A has short-term leases on most of its equipment and can reduce its lease expenditures when production slackens. It has fixed costs of $5 million and variable costs of $1 per unit of output. Firm B has long-term leases on most of its equipment and must make lease payments regardless of economic conditions. Its fixed costs are higher, $8 million, but its variable costs are $0.50 per unit. Firm C has even lower fixed costs than firm A; its fixed costs are $ 2 million and variable costs are $1.50 per unit. Given the table below showing how the firms perform in different economic scenarios, compute and compare the degree of operating leverage for the 3 firms when the economy moves from a normal growth to a recession. Recession Normal A B C A B Sales (million units) 5 5 5 6 6 6 Price per unit $2 $2 $2 $2 $2 $2 Revenue ($ million) 10 10 10 12 12 12 Fixed Costs ($ million) 5 8 2 5 8 2 Variable Costs ($ million) 5 2.5 7.5 6 3 9 Total costs ($ million) 10.0 10.5 9.5 11.0 11.0 11.0 Profits ($ millions) 0.0 -0.5 0.5 1.0 1.0 1.0
Step by Step Solution
There are 3 Steps involved in it
To compute the degree of operating leverage DOL for each firm we will use the following formula DOL ... View full answer

Get step-by-step solutions from verified subject matter experts