

Question: Operating system Consider the information of the processes in a system given below. Process Arrival Time Burst Time P1 148 P2 250 128 P3 100
 Operating system
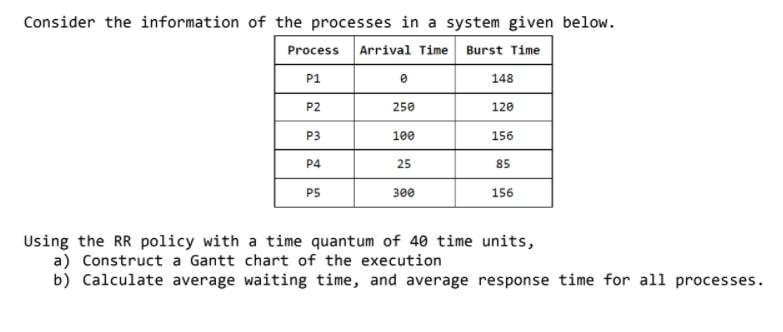
Consider the information of the processes in a system given below. Process Arrival Time Burst Time P1 148 P2 250 128 P3 100 156 P4 25 85 156 P5 Using the RR policy with a time quantum of 40 time units, a) Construct a Gantt chart of the execution b) Calculate average waiting time, and average response time for all processes
Step by Step Solution
There are 3 Steps involved in it
1 Expert Approved Answer
Step: 1 Unlock

Question Has Been Solved by an Expert!
Get step-by-step solutions from verified subject matter experts
Step: 2 Unlock
Step: 3 Unlock