

Question: Operating Systems Complete the time table, CPU grantt chart, IO grantt chart. Replace # with a number. i will rate the work 3. Consider the
Operating Systems
Complete the time table, CPU grantt chart, IO grantt chart.
Replace # with a number.
i will rate the work
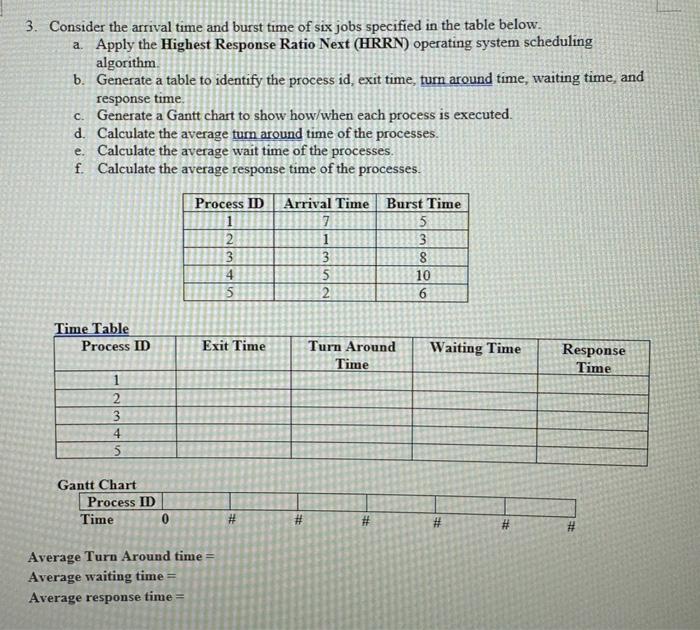
3. Consider the arrival time and burst time of six jobs specified in the table below. a. Apply the Highest Response Ratio Next (HRRN) operating system scheduling algorithm. b. Generate a table to identify the process id, exit time, turn around time, waiting time, and response time. c. Generate a Gantt chart to show how/when each process is executed. d. Calculate the average turn around time of the processes. e. Calculate the average wait time of the processes. f. Calculate the average response time of the processes. Average Turn Around time = Average waiting time = Average response time =
Step by Step Solution
There are 3 Steps involved in it
1 Expert Approved Answer
Step: 1 Unlock

Question Has Been Solved by an Expert!
Get step-by-step solutions from verified subject matter experts
Step: 2 Unlock
Step: 3 Unlock