

Question: Operations Management Case: Earth Buddy Please help me to fix the problem, thanks. Here are the additional useful resources: Earth Buddy was rapidly becoming the
Operations Management Case: Earth Buddy
Please help me to fix the problem, thanks.
Here are the additional useful resources:
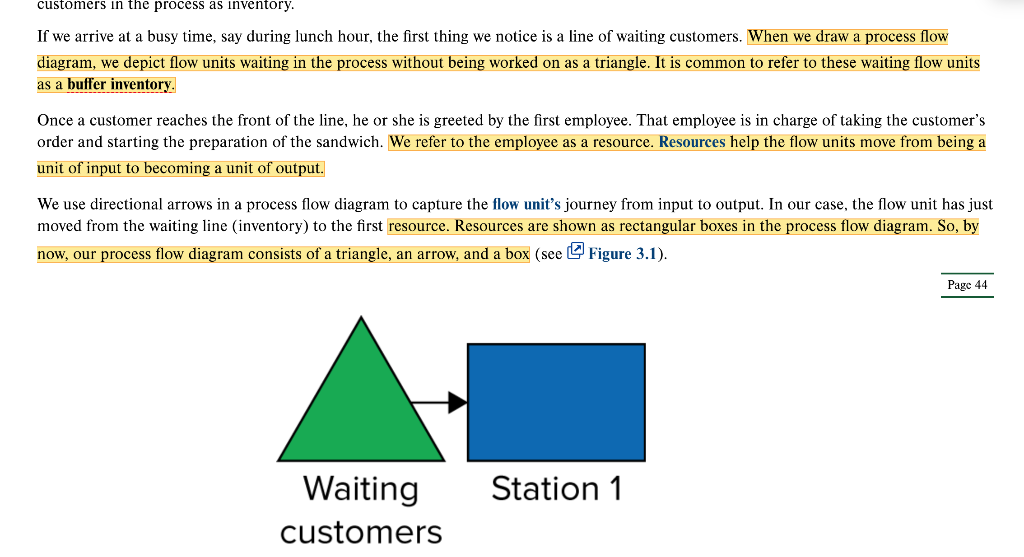
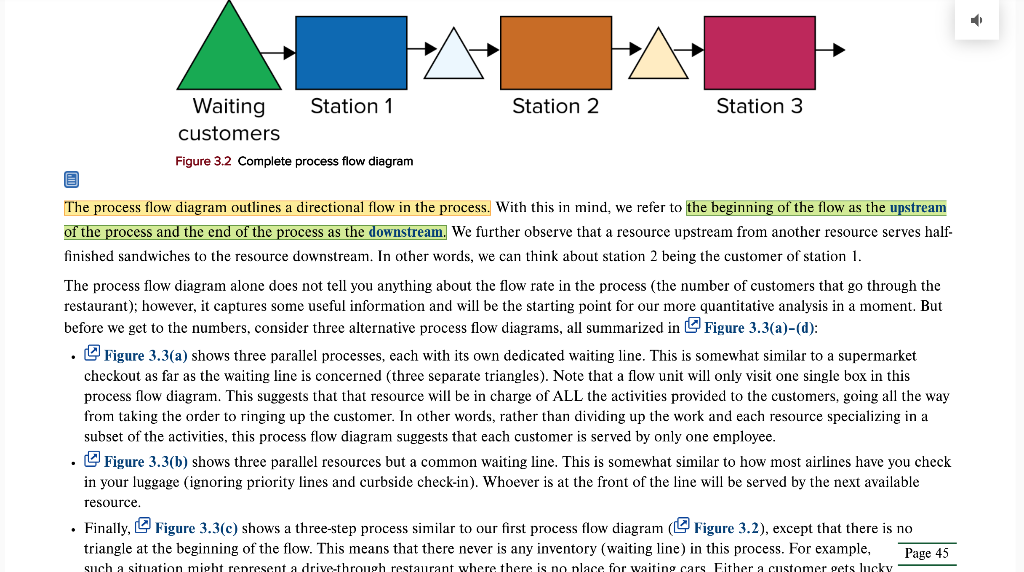
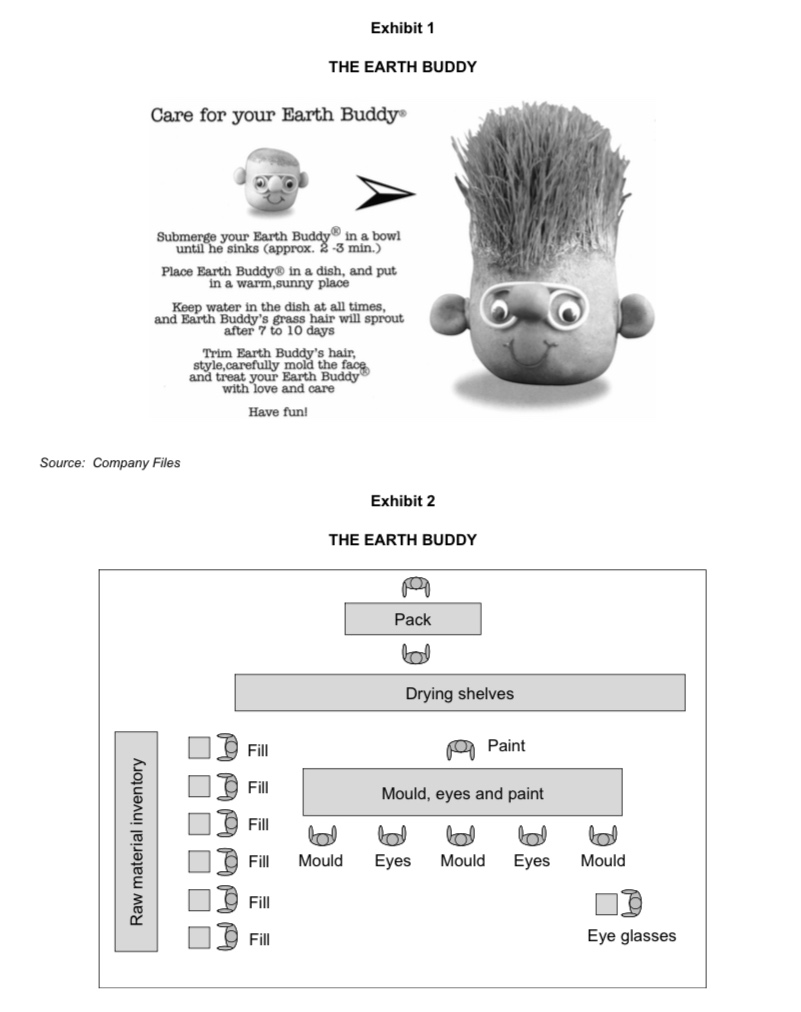
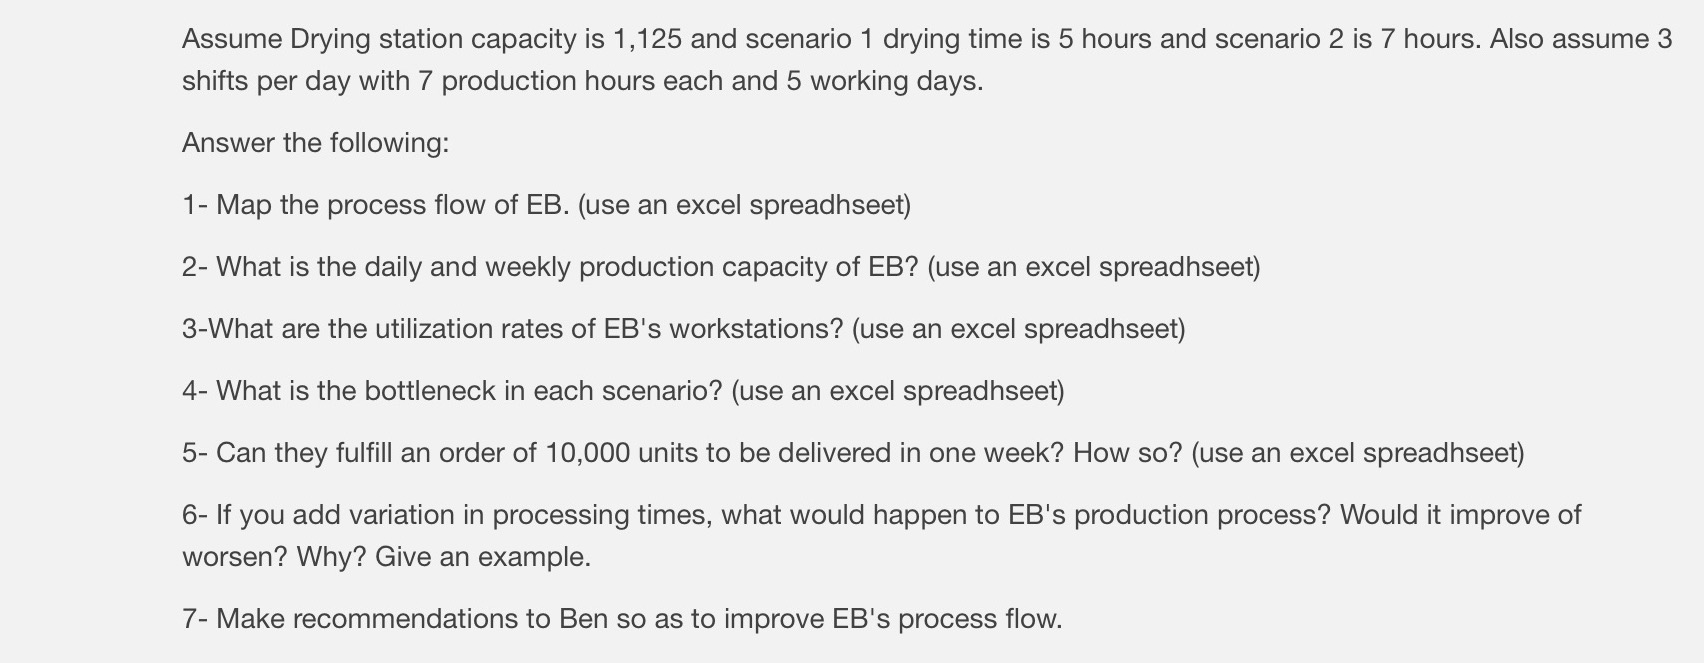
Earth Buddy was rapidly becoming the hit novelty item of the summer. Although it was only mid-July, Seiger Marketing had already moved and expanded its Earth Buddy division's factory and warehouse twice since production began in mid-April. Even so, current production levels were straining the physical limits of its latest facility in Toronto, Ontario. Nothing was certain, however, and Anton Rabie and Ronnen Harary, recent Ivey Business School graduates and Earth Buddy's co-owners, were reluctant to give their production director and business school classmate, Ben Varadi, any production advice except: "Remain flexible. We could get an order for 100,000 units, but if the order doesn't arrive, we would have to put the workforce on hold. We can't afford to carry large inventories. Against this background of uncertainty, Ben was looking for ways to increase his capacity and stay flexible at a minimum of expense. THE PRODUCT When the Earth Buddies' owners removed them from their boxes, they found a bald, but cute, humanlike head about eight centimetres in diameter. After soaking in water and sitting in a moist environment for a few days, the Earth Buddy sprouted a beautiful head of green hair. See Exhibit 1 for the before and after look. The owner's creativity could be expressed through the hair's styling. Earth Buddy sales had originally been through Toronto-area flower shops and gift stores, but as the product's wide appeal began to be realized, distribution spread nationally through stores such as K-Mart, Toys R Us, and Wal-Mart. By mid-July, over 100,000 units had been sold in Canada, and exports had begun to the United States. THE PROCESS Earth Buddies were produced in a hybrid batch-flow process illustrated in Exhibit 2. Six filling-machine operators working in parallel produced the basic rounded shapes by filling pieces of nylon stocking with sawdust and grass seed. The operators placed the heads in plastic tote boxes that held batches of about 25 heads. In another batch operation, an operator shaped the Earth Buddies' eye glasses by wrapping plastic- coated wire around a simple jig composed of two short, vertically-mounted dowels. The remainder of the process was a worker-paced flow. Three moulding operators removed the heads from the tote boxes, and formed the nose and ears with the help of elastic bands. Next, two people working between the moulders placed the previously-formed eye glasses over the nose, and glued small plastic eyes inside the rims. Each shaped and assembled Earth Buddy was placed in a bin for the painter, who fashioned a red mouth with fabric paint before placing the head on shelving to dry. Drying usually took about five hours, but could take as long as seven hours during humid summer days. After drying, two packers placed the Earth Buddies in boxes, and then into cartons ready for shipment. Work in process inventory (WIP) prior to drying was not large. Typically about 250 heads were at various stages of completion between filling and painting, but sometimes WIP seemed to grow much larger. In an effort to analyse his capacities, Ben and his day supervisor, Bob Wakelam, estimated the time it took an operator to process and move an Earth Buddy through each step. The times were: filling 1.5 minutes, moulding - 0.8 minutes, eyes - 0.4 minutes, eye glass fabrication - 0.2 minutes, painting - 0.25 minutes, and packing - 0.33 minutes. After allowing for unavoidable delays and rest periods, Ben figured that he could count on seven hours of production from each eight-hour shift. With weather forecasts calling for more hot, humid summer days, Ben wondered how his production capacity and WIP levels might be affected. Exhibit 1 THE EARTH BUDDY Care for your Earth Buddy Submerge your Earth Buddy in a bowl until he sinks (approx. 2-3 min.) Place Earth Buddy in a dish, and put in a warm,sunny place Keep water in the dish at all times, and Earth Buddy's grass hair will sprout after 7 to 10 days Trim Earth Buddy's hair, style,carefully mold the face and treat your Earth Buddy with love and care Have fun! Company Files Exhibit 2 THE EARTH BUDDY Pack load Drying shelves Fill Paint Fill Mould, eyes and paint Fill Raw material inventory O Fill Mould Eyes Mould Eyes Mould Fill Fill Eye glasses Assume Drying station capacity is 1,125 and scenario 1 drying time is 5 hours and scenario 2 is 7 hours. Also assume 3 shifts per day with 7 production hours each and 5 working days. Answer the following: 1- Map the process flow of EB. (use an excel spreadhseet) 2- What is the daily and weekly production capacity of EB? (use an excel spreadhseet) 3-What are the utilization rates of EB's workstations? (use an excel spreadhseet) 4- What is the bottleneck in each scenario? (use an excel spreadhseet) 5- Can they fulfill an order of 10,000 units to be delivered in one week? How so? (use an excel spreadhseet) 6- If you add variation in processing times, what would happen to EB's production process? Would it improve of worsen? Why? Give an example. 7- Make recommendations to Ben so as to improve EB's process flow. Process analysis, the topic of this chapter, provides a rigorous framework for understanding the detailed operations of a business, including the answers to the questions raised in the introduction. Process analysis opens the black box of the operations and peeks inside by identifying and analyzing all the activities involved in serving one unit of demand, or, put differently, in providing one unit of supply. In this chapter, you will learn how to perform a process analysis. Once you have analyzed the process, you can improve it: You can serve more customers, you can find the right number of employees to work for you, and you can get your customers what they want in less time. In short, you can make your process better. Process analysis is a framework that can be used for everyone running a business. It can be used by the one who owns the restaurant, by those managing the restaurant, by those working in the restaurant, or by those consulting to the restaurant. In smaller restaurants, this is the responsibility of the owner. In bigger restaurants or restaurant chains, many job positions exist that include the term operations in it (such as Vice President of Operations, Chief Operating Officer, Director of Operations, Operations Expert, etc.). But understanding the operations of a business, we argue, is important to everybody. After all, wouldn't everybody in the business have an interest in making it better? To state the obvious, this book and this chapter are not just about restaurants. At the risk of offending the (future) doctors and nurses in our readership, we propose that the framework of process analysis is just as valuable in a hospital as it is in a restaurant. Serving more patients, making sure that we have the right number of doctors and nurses available, and avoiding long patient wait timesin other words, to improve health care operations requires process analysis. So, for restaurants, hospitals, or any other business, the purpose of process analysis is to make the business better. LO3-1 Draw a process flow diagram. The best way to begin any analysis of an operation is by drawing a process flow diagram. A process flow diagram is a graphical way to describe the process. It will help us structure the information we collect as we try to improve our understanding of the process. We illustrate this new material using the case of a Subway restaurant. We feel that a restaurant provides a good example, because we assume that most of you have been in restaurants, maybe even a Subway restaurant. This way, you can connect the academic content with the reality of daily life. At the aggregate level, the restaurant consists of a number of customers, a set of employees (at Subway, oftentimes called sandwich artists, though we label them as employees), some workstations, and a cash register. Just as you have a recipe when you prepare a meal, Subway has a recipe for its sandwiches. The recipe for a sandwich provides you with detailed instructions on how to make the sandwich. Table 3.1 provides you with instructions on how to prepare a sandwich. We Page 43 refer to the steps shown in the table as activities. Some of the activities in Table 3.1 directly relate to making a sandwich (e.g., cutting the bread). But Table 3.1 also includes activities that need to happen when interacting with customers in a restaurant, from greeting the customer to ringing up the customer at the cash register. customers in the process as inventory. If we arrive at a busy time, say during lunch hour, the first thing we notice is a line of waiting customers. When we draw a process flow diagram, we depict flow units waiting in the process without being worked on as a triangle. It is common to refer to these waiting flow units as a buffer inventory. Once a customer reaches the front of the line, he or she is greeted by the first employee. That employee is in charge of taking the customer's order and starting the preparation of the sandwich. We refer to the employee as a resource. Resources help the flow units move from being a unit of input to becoming a unit of output. We use directional arrows in a process flow diagram to capture the flow unit's journey from input to output. In our case, the flow unit has just moved from the waiting line (inventory) to the first resource. Resources are shown as rectangular boxes in the process flow diagram. So, by now, our process flow diagram consists of a triangle, an arrow, and a box (see Figure 3.1). Page 44 Station 1 Waiting customers 0 Station 2 Station 3 Waiting Station 1 customers Figure 3.2 Complete process flow diagram The process flow diagram outlines a directional flow in the process. With this in mind, we refer to the beginning of the flow as the upstream of the process and the end of the process as the downstream. We further observe that a resource upstream from another resource serves half- finished sandwiches to the resource downstream. In other words, we can think about station 2 being the customer of station 1. The process flow diagram alone does not tell you anything about the flow rate in the process (the number of customers that go through the restaurant); however, it captures some useful information and will be the starting point for our more quantitative analysis in a moment. But before we get to the numbers, consider three alternative process flow diagrams, all summarized in Figure 3.3(a)-(d): . Figure 3.3(a) shows three parallel processes, each with its own dedicated waiting line. This is somewhat similar to a supermarket checkout as far as the waiting line is concerned (three separate triangles). Note that a flow unit will only visit one single box in this process flow diagram. This suggests that that resource will in charge of ALL the activities provided to the customers, going all the way from taking the order to ringing up the customer. In other words, rather than dividing up the work and each resource specializing in a subset of the activities, this process flow diagram suggests that each customer is served by only one employee. Figure 3.3(b) shows three parallel reso but common waiting line. This is somewhat similar to how most airlines have you check in your luggage (ignoring priority lines and curbside check-in). Whoever is at the front of the line will be served by the next available resource. . Finally, Figure 3.3(e) shows a three-step process similar to our first process flow diagram (Figure 3.2), except that there is no triangle at the beginning of the flow. This means that there never is any inventory (waiting line) in this process. For example, Page 45 such a situation might represent a drive-through restaurant where there is no place for waiting cars Either a customer pets lucky Earth Buddy was rapidly becoming the hit novelty item of the summer. Although it was only mid-July, Seiger Marketing had already moved and expanded its Earth Buddy division's factory and warehouse twice since production began in mid-April. Even so, current production levels were straining the physical limits of its latest facility in Toronto, Ontario. Nothing was certain, however, and Anton Rabie and Ronnen Harary, recent Ivey Business School graduates and Earth Buddy's co-owners, were reluctant to give their production director and business school classmate, Ben Varadi, any production advice except: "Remain flexible. We could get an order for 100,000 units, but if the order doesn't arrive, we would have to put the workforce on hold. We can't afford to carry large inventories. Against this background of uncertainty, Ben was looking for ways to increase his capacity and stay flexible at a minimum of expense. THE PRODUCT When the Earth Buddies' owners removed them from their boxes, they found a bald, but cute, humanlike head about eight centimetres in diameter. After soaking in water and sitting in a moist environment for a few days, the Earth Buddy sprouted a beautiful head of green hair. See Exhibit 1 for the before and after look. The owner's creativity could be expressed through the hair's styling. Earth Buddy sales had originally been through Toronto-area flower shops and gift stores, but as the product's wide appeal began to be realized, distribution spread nationally through stores such as K-Mart, Toys R Us, and Wal-Mart. By mid-July, over 100,000 units had been sold in Canada, and exports had begun to the United States. THE PROCESS Earth Buddies were produced in a hybrid batch-flow process illustrated in Exhibit 2. Six filling-machine operators working in parallel produced the basic rounded shapes by filling pieces of nylon stocking with sawdust and grass seed. The operators placed the heads in plastic tote boxes that held batches of about 25 heads. In another batch operation, an operator shaped the Earth Buddies' eye glasses by wrapping plastic- coated wire around a simple jig composed of two short, vertically-mounted dowels. The remainder of the process was a worker-paced flow. Three moulding operators removed the heads from the tote boxes, and formed the nose and ears with the help of elastic bands. Next, two people working between the moulders placed the previously-formed eye glasses over the nose, and glued small plastic eyes inside the rims. Each shaped and assembled Earth Buddy was placed in a bin for the painter, who fashioned a red mouth with fabric paint before placing the head on shelving to dry. Drying usually took about five hours, but could take as long as seven hours during humid summer days. After drying, two packers placed the Earth Buddies in boxes, and then into cartons ready for shipment. Work in process inventory (WIP) prior to drying was not large. Typically about 250 heads were at various stages of completion between filling and painting, but sometimes WIP seemed to grow much larger. In an effort to analyse his capacities, Ben and his day supervisor, Bob Wakelam, estimated the time it took an operator to process and move an Earth Buddy through each step. The times were: filling 1.5 minutes, moulding - 0.8 minutes, eyes - 0.4 minutes, eye glass fabrication - 0.2 minutes, painting - 0.25 minutes, and packing - 0.33 minutes. After allowing for unavoidable delays and rest periods, Ben figured that he could count on seven hours of production from each eight-hour shift. With weather forecasts calling for more hot, humid summer days, Ben wondered how his production capacity and WIP levels might be affected. Exhibit 1 THE EARTH BUDDY Care for your Earth Buddy Submerge your Earth Buddy in a bowl until he sinks (approx. 2-3 min.) Place Earth Buddy in a dish, and put in a warm,sunny place Keep water in the dish at all times, and Earth Buddy's grass hair will sprout after 7 to 10 days Trim Earth Buddy's hair, style,carefully mold the face and treat your Earth Buddy with love and care Have fun! Company Files Exhibit 2 THE EARTH BUDDY Pack load Drying shelves Fill Paint Fill Mould, eyes and paint Fill Raw material inventory O Fill Mould Eyes Mould Eyes Mould Fill Fill Eye glasses Assume Drying station capacity is 1,125 and scenario 1 drying time is 5 hours and scenario 2 is 7 hours. Also assume 3 shifts per day with 7 production hours each and 5 working days. Answer the following: 1- Map the process flow of EB. (use an excel spreadhseet) 2- What is the daily and weekly production capacity of EB? (use an excel spreadhseet) 3-What are the utilization rates of EB's workstations? (use an excel spreadhseet) 4- What is the bottleneck in each scenario? (use an excel spreadhseet) 5- Can they fulfill an order of 10,000 units to be delivered in one week? How so? (use an excel spreadhseet) 6- If you add variation in processing times, what would happen to EB's production process? Would it improve of worsen? Why? Give an example. 7- Make recommendations to Ben so as to improve EB's process flow. Process analysis, the topic of this chapter, provides a rigorous framework for understanding the detailed operations of a business, including the answers to the questions raised in the introduction. Process analysis opens the black box of the operations and peeks inside by identifying and analyzing all the activities involved in serving one unit of demand, or, put differently, in providing one unit of supply. In this chapter, you will learn how to perform a process analysis. Once you have analyzed the process, you can improve it: You can serve more customers, you can find the right number of employees to work for you, and you can get your customers what they want in less time. In short, you can make your process better. Process analysis is a framework that can be used for everyone running a business. It can be used by the one who owns the restaurant, by those managing the restaurant, by those working in the restaurant, or by those consulting to the restaurant. In smaller restaurants, this is the responsibility of the owner. In bigger restaurants or restaurant chains, many job positions exist that include the term operations in it (such as Vice President of Operations, Chief Operating Officer, Director of Operations, Operations Expert, etc.). But understanding the operations of a business, we argue, is important to everybody. After all, wouldn't everybody in the business have an interest in making it better? To state the obvious, this book and this chapter are not just about restaurants. At the risk of offending the (future) doctors and nurses in our readership, we propose that the framework of process analysis is just as valuable in a hospital as it is in a restaurant. Serving more patients, making sure that we have the right number of doctors and nurses available, and avoiding long patient wait timesin other words, to improve health care operations requires process analysis. So, for restaurants, hospitals, or any other business, the purpose of process analysis is to make the business better. LO3-1 Draw a process flow diagram. The best way to begin any analysis of an operation is by drawing a process flow diagram. A process flow diagram is a graphical way to describe the process. It will help us structure the information we collect as we try to improve our understanding of the process. We illustrate this new material using the case of a Subway restaurant. We feel that a restaurant provides a good example, because we assume that most of you have been in restaurants, maybe even a Subway restaurant. This way, you can connect the academic content with the reality of daily life. At the aggregate level, the restaurant consists of a number of customers, a set of employees (at Subway, oftentimes called sandwich artists, though we label them as employees), some workstations, and a cash register. Just as you have a recipe when you prepare a meal, Subway has a recipe for its sandwiches. The recipe for a sandwich provides you with detailed instructions on how to make the sandwich. Table 3.1 provides you with instructions on how to prepare a sandwich. We Page 43 refer to the steps shown in the table as activities. Some of the activities in Table 3.1 directly relate to making a sandwich (e.g., cutting the bread). But Table 3.1 also includes activities that need to happen when interacting with customers in a restaurant, from greeting the customer to ringing up the customer at the cash register. customers in the process as inventory. If we arrive at a busy time, say during lunch hour, the first thing we notice is a line of waiting customers. When we draw a process flow diagram, we depict flow units waiting in the process without being worked on as a triangle. It is common to refer to these waiting flow units as a buffer inventory. Once a customer reaches the front of the line, he or she is greeted by the first employee. That employee is in charge of taking the customer's order and starting the preparation of the sandwich. We refer to the employee as a resource. Resources help the flow units move from being a unit of input to becoming a unit of output. We use directional arrows in a process flow diagram to capture the flow unit's journey from input to output. In our case, the flow unit has just moved from the waiting line (inventory) to the first resource. Resources are shown as rectangular boxes in the process flow diagram. So, by now, our process flow diagram consists of a triangle, an arrow, and a box (see Figure 3.1). Page 44 Station 1 Waiting customers 0 Station 2 Station 3 Waiting Station 1 customers Figure 3.2 Complete process flow diagram The process flow diagram outlines a directional flow in the process. With this in mind, we refer to the beginning of the flow as the upstream of the process and the end of the process as the downstream. We further observe that a resource upstream from another resource serves half- finished sandwiches to the resource downstream. In other words, we can think about station 2 being the customer of station 1. The process flow diagram alone does not tell you anything about the flow rate in the process (the number of customers that go through the restaurant); however, it captures some useful information and will be the starting point for our more quantitative analysis in a moment. But before we get to the numbers, consider three alternative process flow diagrams, all summarized in Figure 3.3(a)-(d): . Figure 3.3(a) shows three parallel processes, each with its own dedicated waiting line. This is somewhat similar to a supermarket checkout as far as the waiting line is concerned (three separate triangles). Note that a flow unit will only visit one single box in this process flow diagram. This suggests that that resource will in charge of ALL the activities provided to the customers, going all the way from taking the order to ringing up the customer. In other words, rather than dividing up the work and each resource specializing in a subset of the activities, this process flow diagram suggests that each customer is served by only one employee. Figure 3.3(b) shows three parallel reso but common waiting line. This is somewhat similar to how most airlines have you check in your luggage (ignoring priority lines and curbside check-in). Whoever is at the front of the line will be served by the next available resource. . Finally, Figure 3.3(e) shows a three-step process similar to our first process flow diagram (Figure 3.2), except that there is no triangle at the beginning of the flow. This means that there never is any inventory (waiting line) in this process. For example, Page 45 such a situation might represent a drive-through restaurant where there is no place for waiting cars Either a customer pets lucky
Step by Step Solution
There are 3 Steps involved in it
1 Expert Approved Answer
Step: 1 Unlock

Question Has Been Solved by an Expert!
Get step-by-step solutions from verified subject matter experts
Step: 2 Unlock
Step: 3 Unlock